The SmartKalea project has created a smart platform that has made it possible to obtain monitoring and management indicators for the different subsystems deployed in the project.
See moreSmartKalea Data
What has been analysed?
What has been measured?
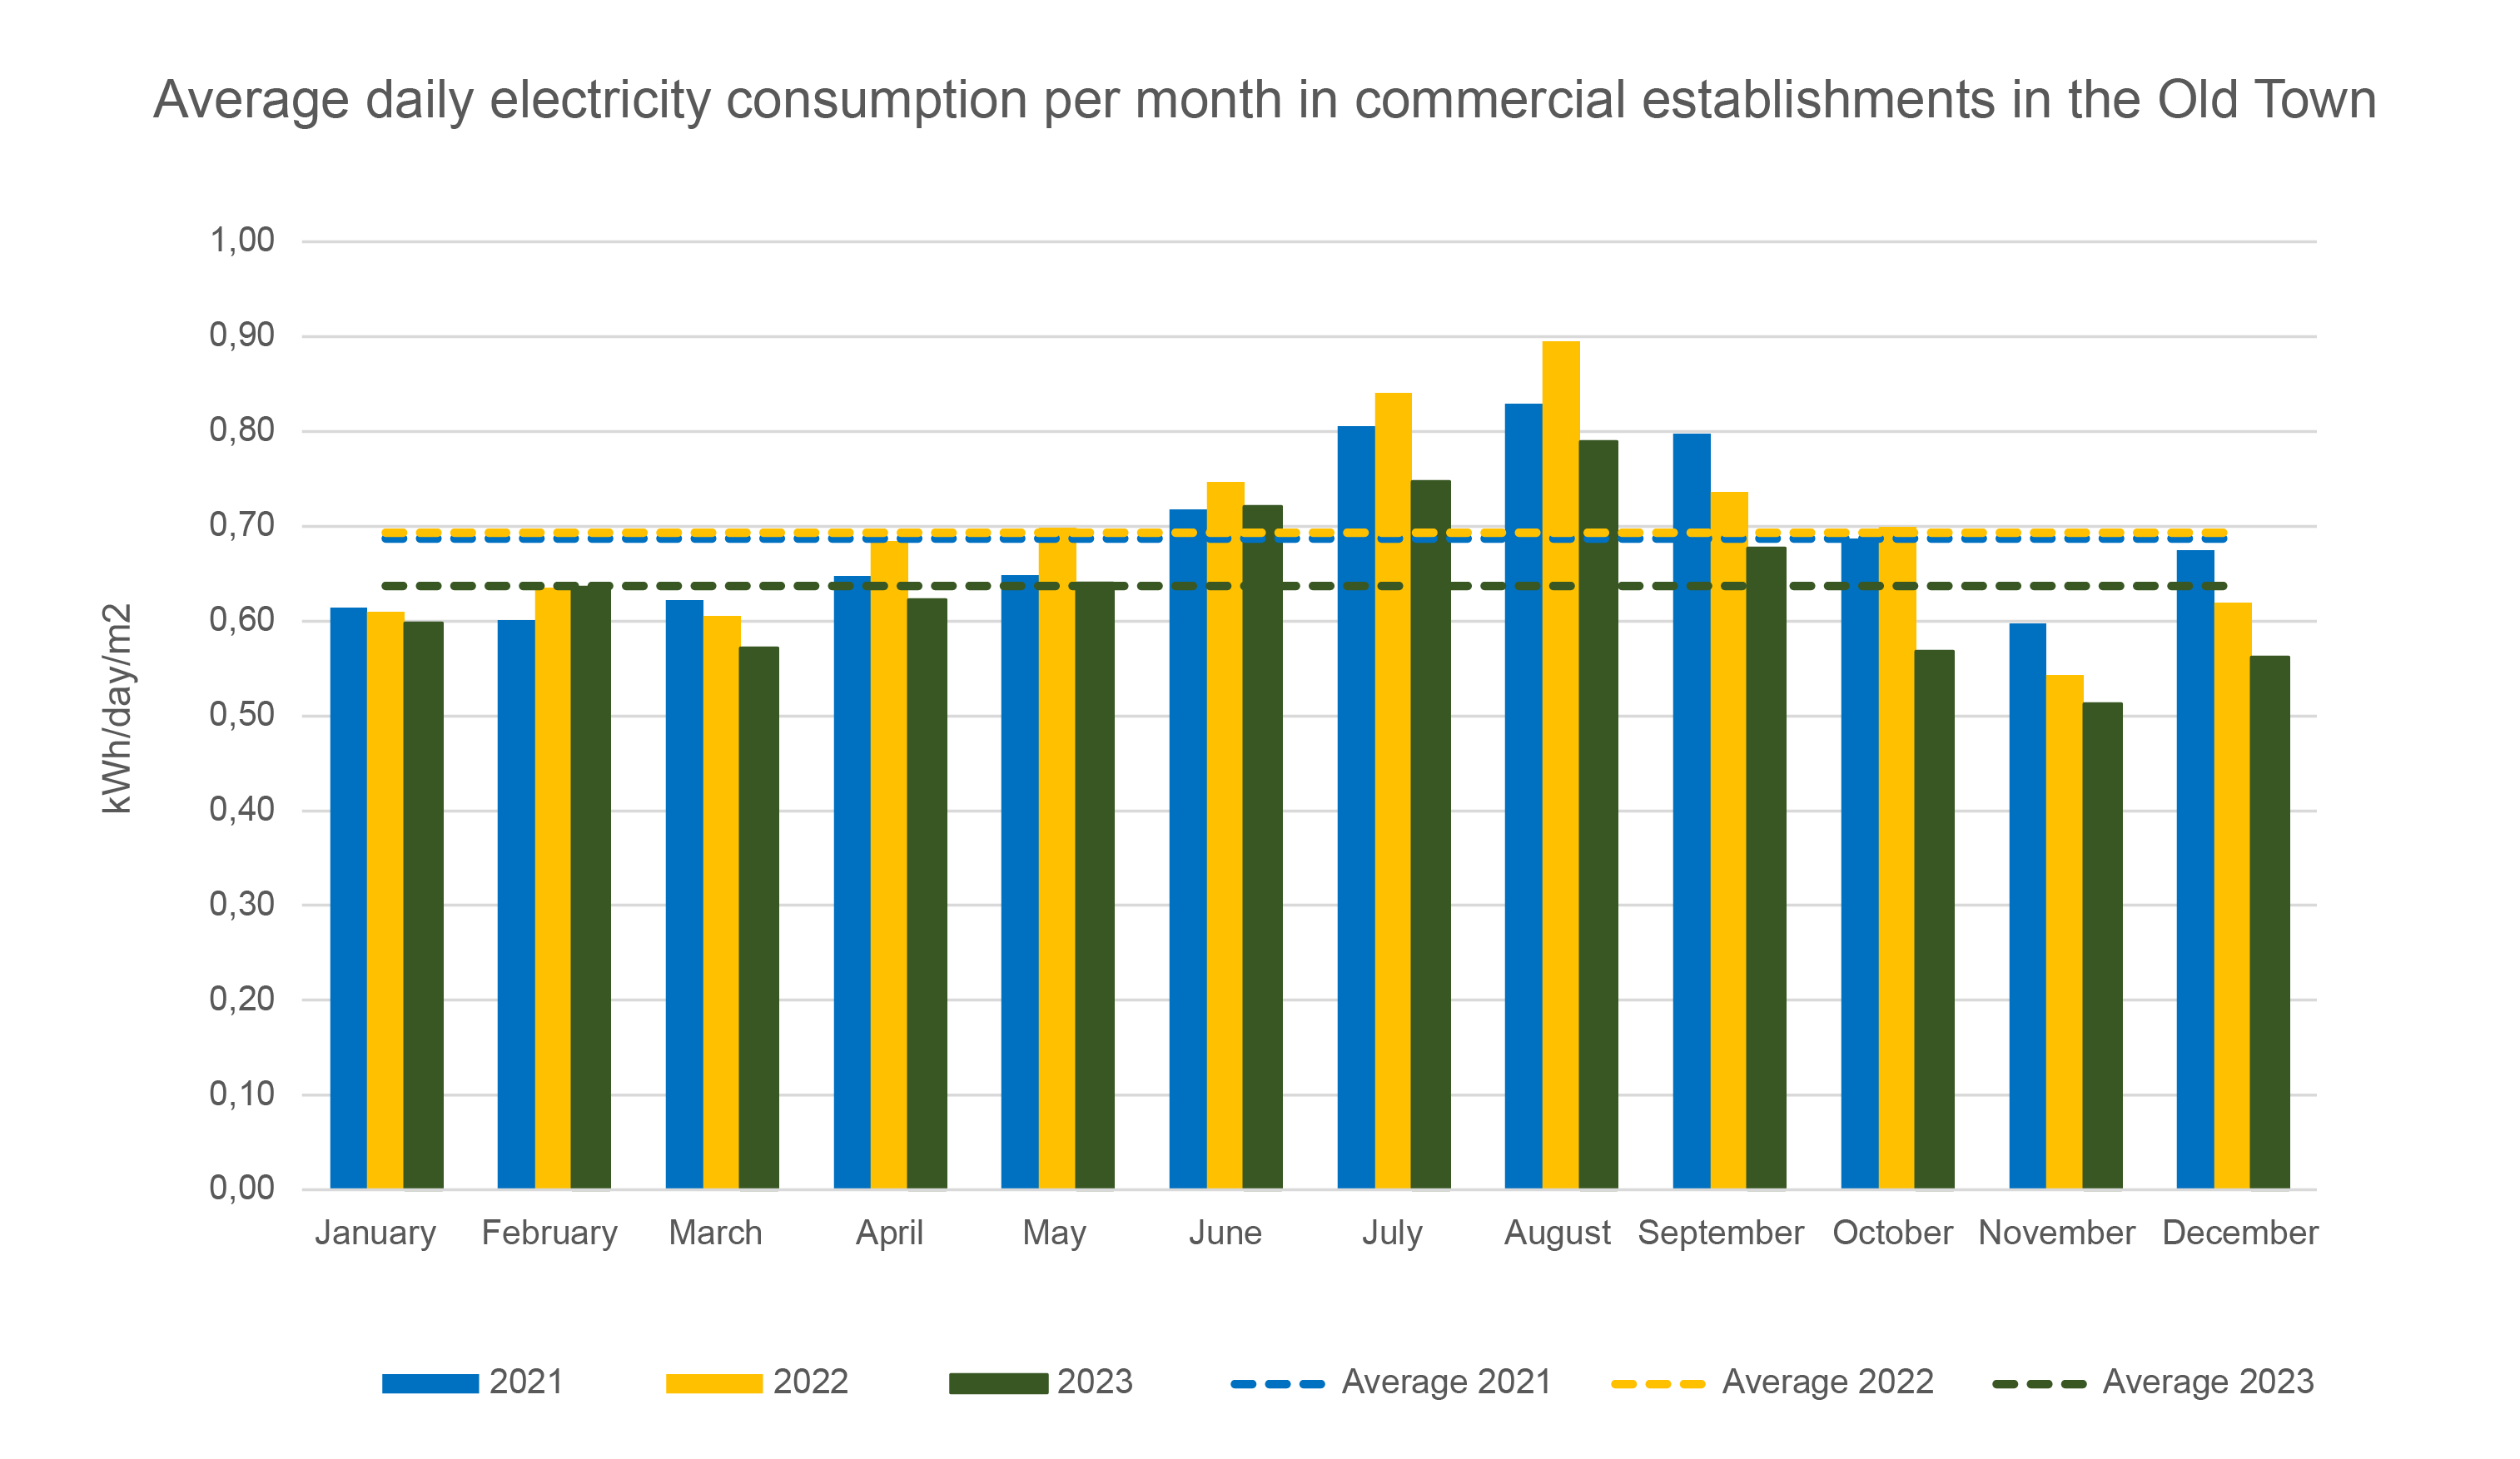
Smart meters and energy platforms have been used to monitor electricity consumption in homes and businesses/hotels and restaurants involved in the SmartKalea project.
The neighbourhoods in which the consumption in commercial establishments was analysed were as follows: Old Town, Altza, Sancho el Sabio, Txomin and Centre. However, the consumption in commercial establishments in the tourist leisure sector has been compiled differently.
In addition, the consumption of homes in the Old Town, Altza, Sancho el Sabio and Txomin has been collected anonymously.
The monitoring of consumption has helped to improve the energy efficiency of households and establishments, thereby encouraging the continuous monitoring of consumption and the adoption of energy-saving measures.
Measured data
What district?
What has been achieved?
208
Businesses have received advice on energy efficiency
33
%
Average economic savings have been achieved compared to existing market tariffs thanks to the creation of consumer groups that purchase renewable energy on a wholesale basis and have negotiated the price of energy from the supply companies
74
Businesses taking part in the 3 purchasing groups in 2021, 2022 and 2023
>9.400
kg of CO2 per year are estimated to be saved by implementing the proposed measures in one year of visits: changeover to LED lighting, improvements to air conditioning, building envelopes…
Electric power consumption per capita around the world
Check out the electric power consumption per capita in different regions of the world. Note that these data cannot be directly compared, since the use of energy is locally affected by climate, social, cultural and economic variables.
Daily household electricity usage per capita by city
Sources
https://wec-indicators.enerdata.net

Average daily electricity consumption per month in commercial establishments in the Old Town
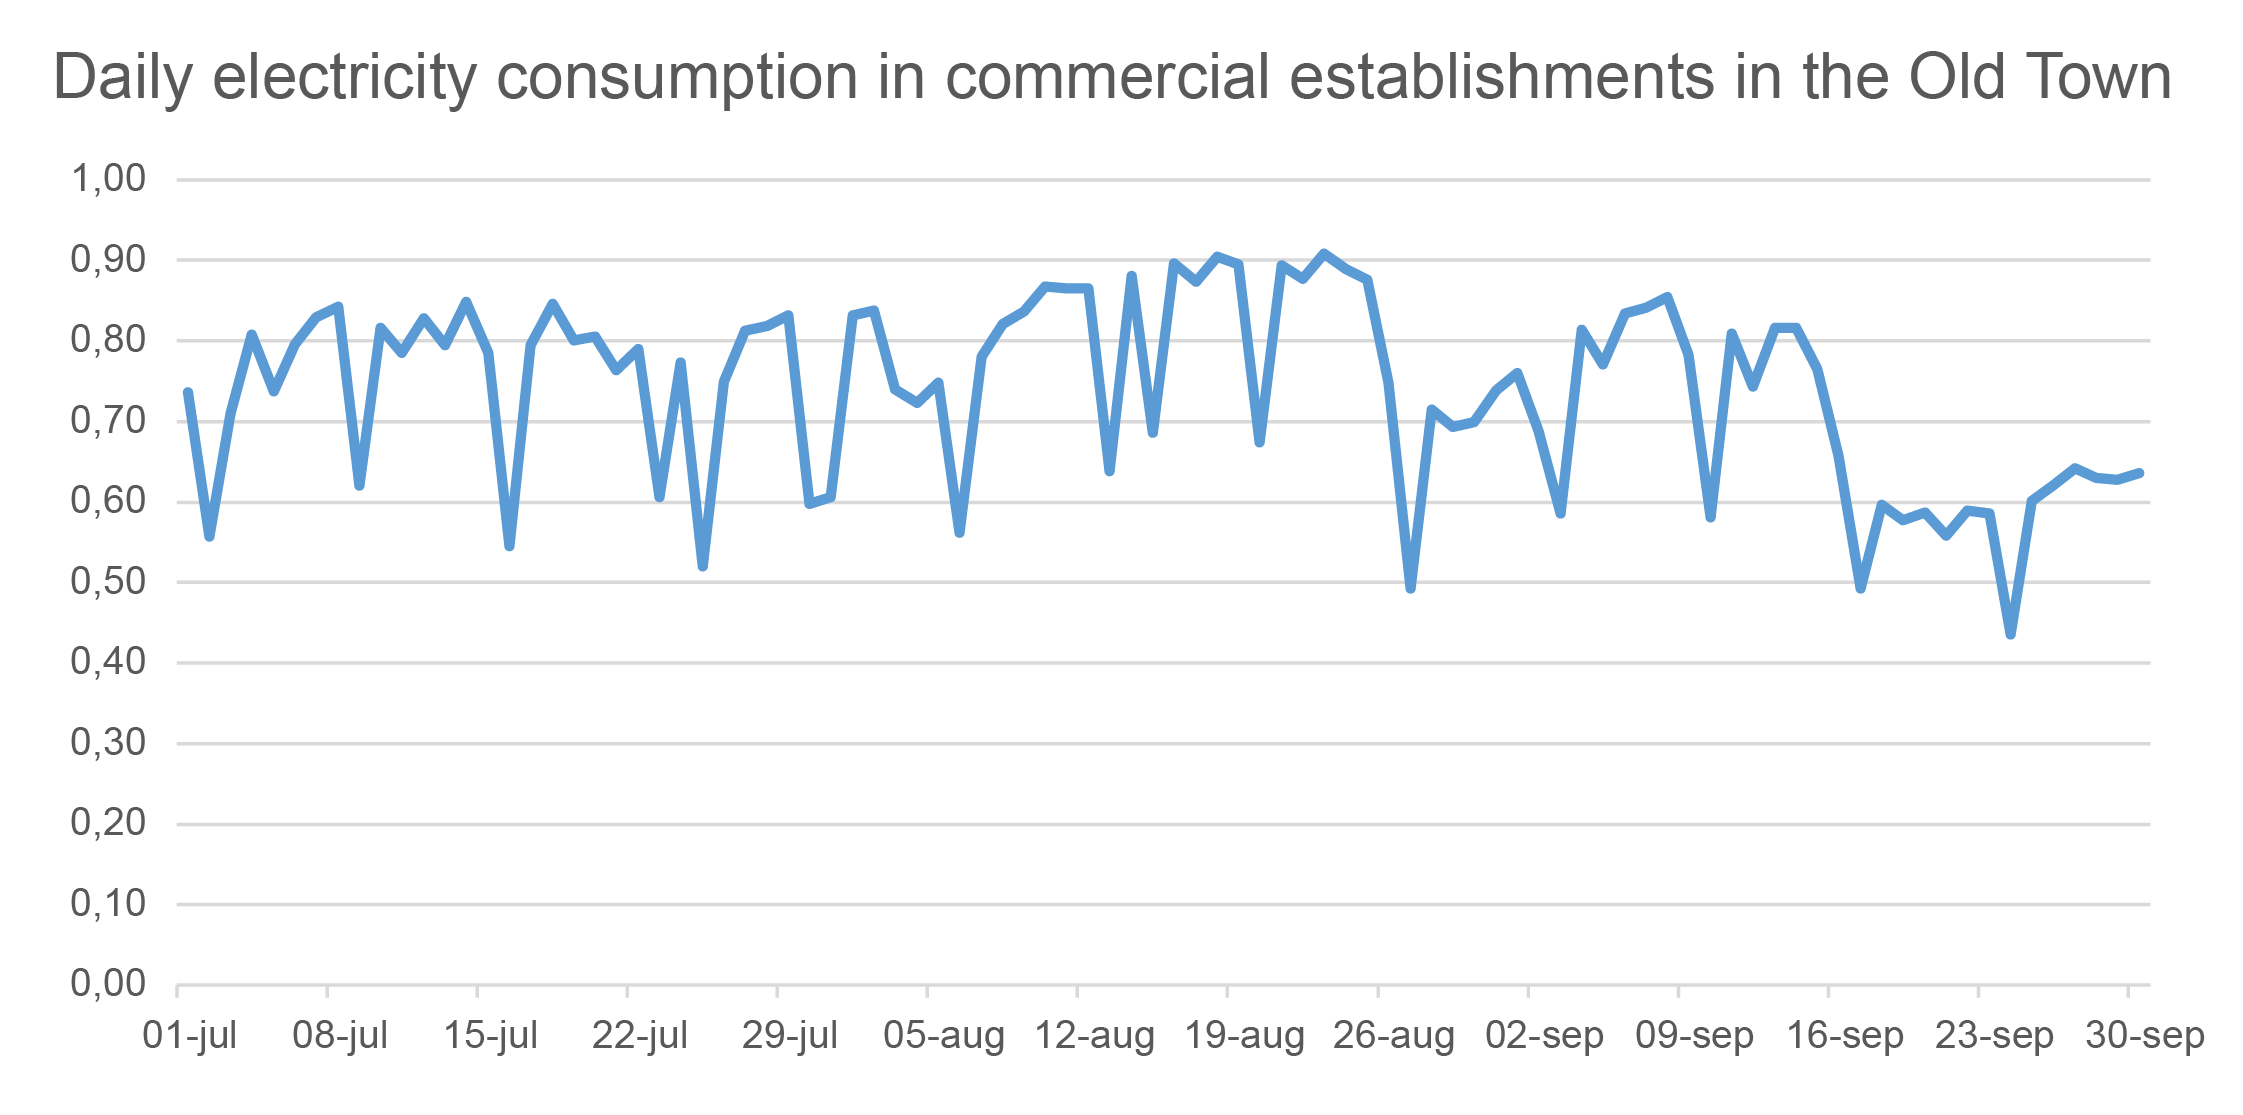
Daily electricity consumption in commercial establishments in the Old Town
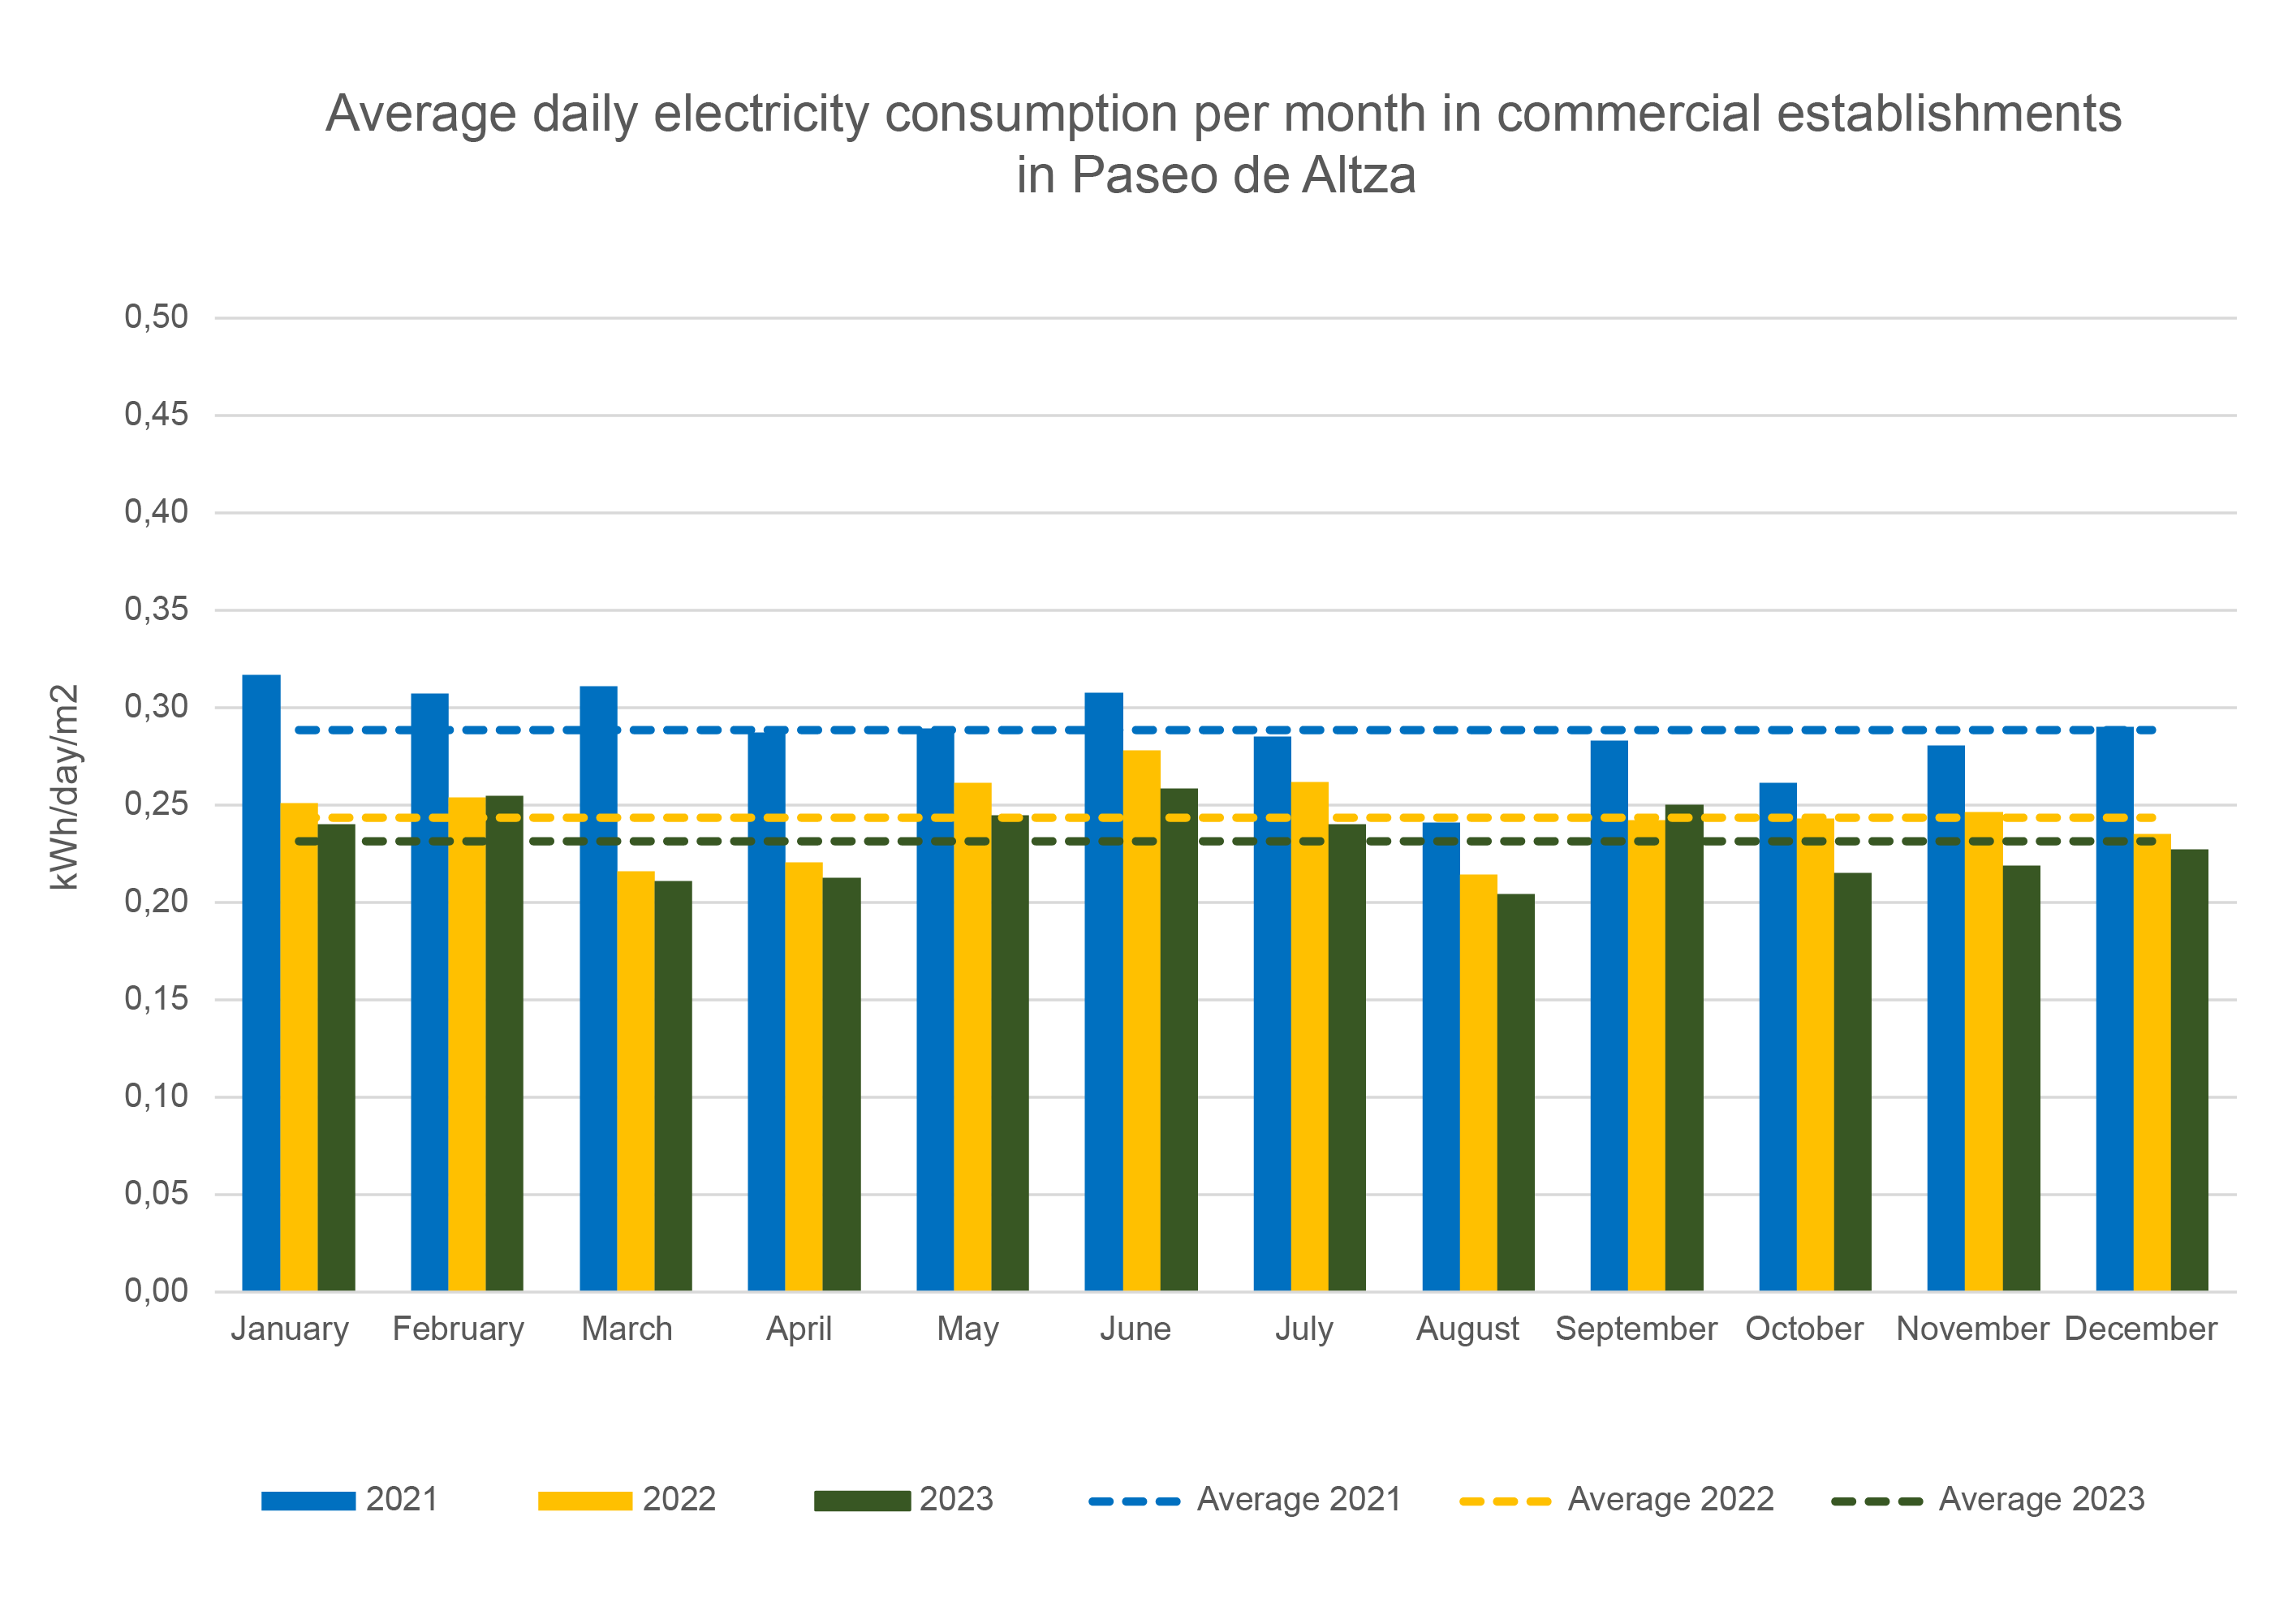
Average daily electricity consumption per month in commercial establishments in Paseo de Altza
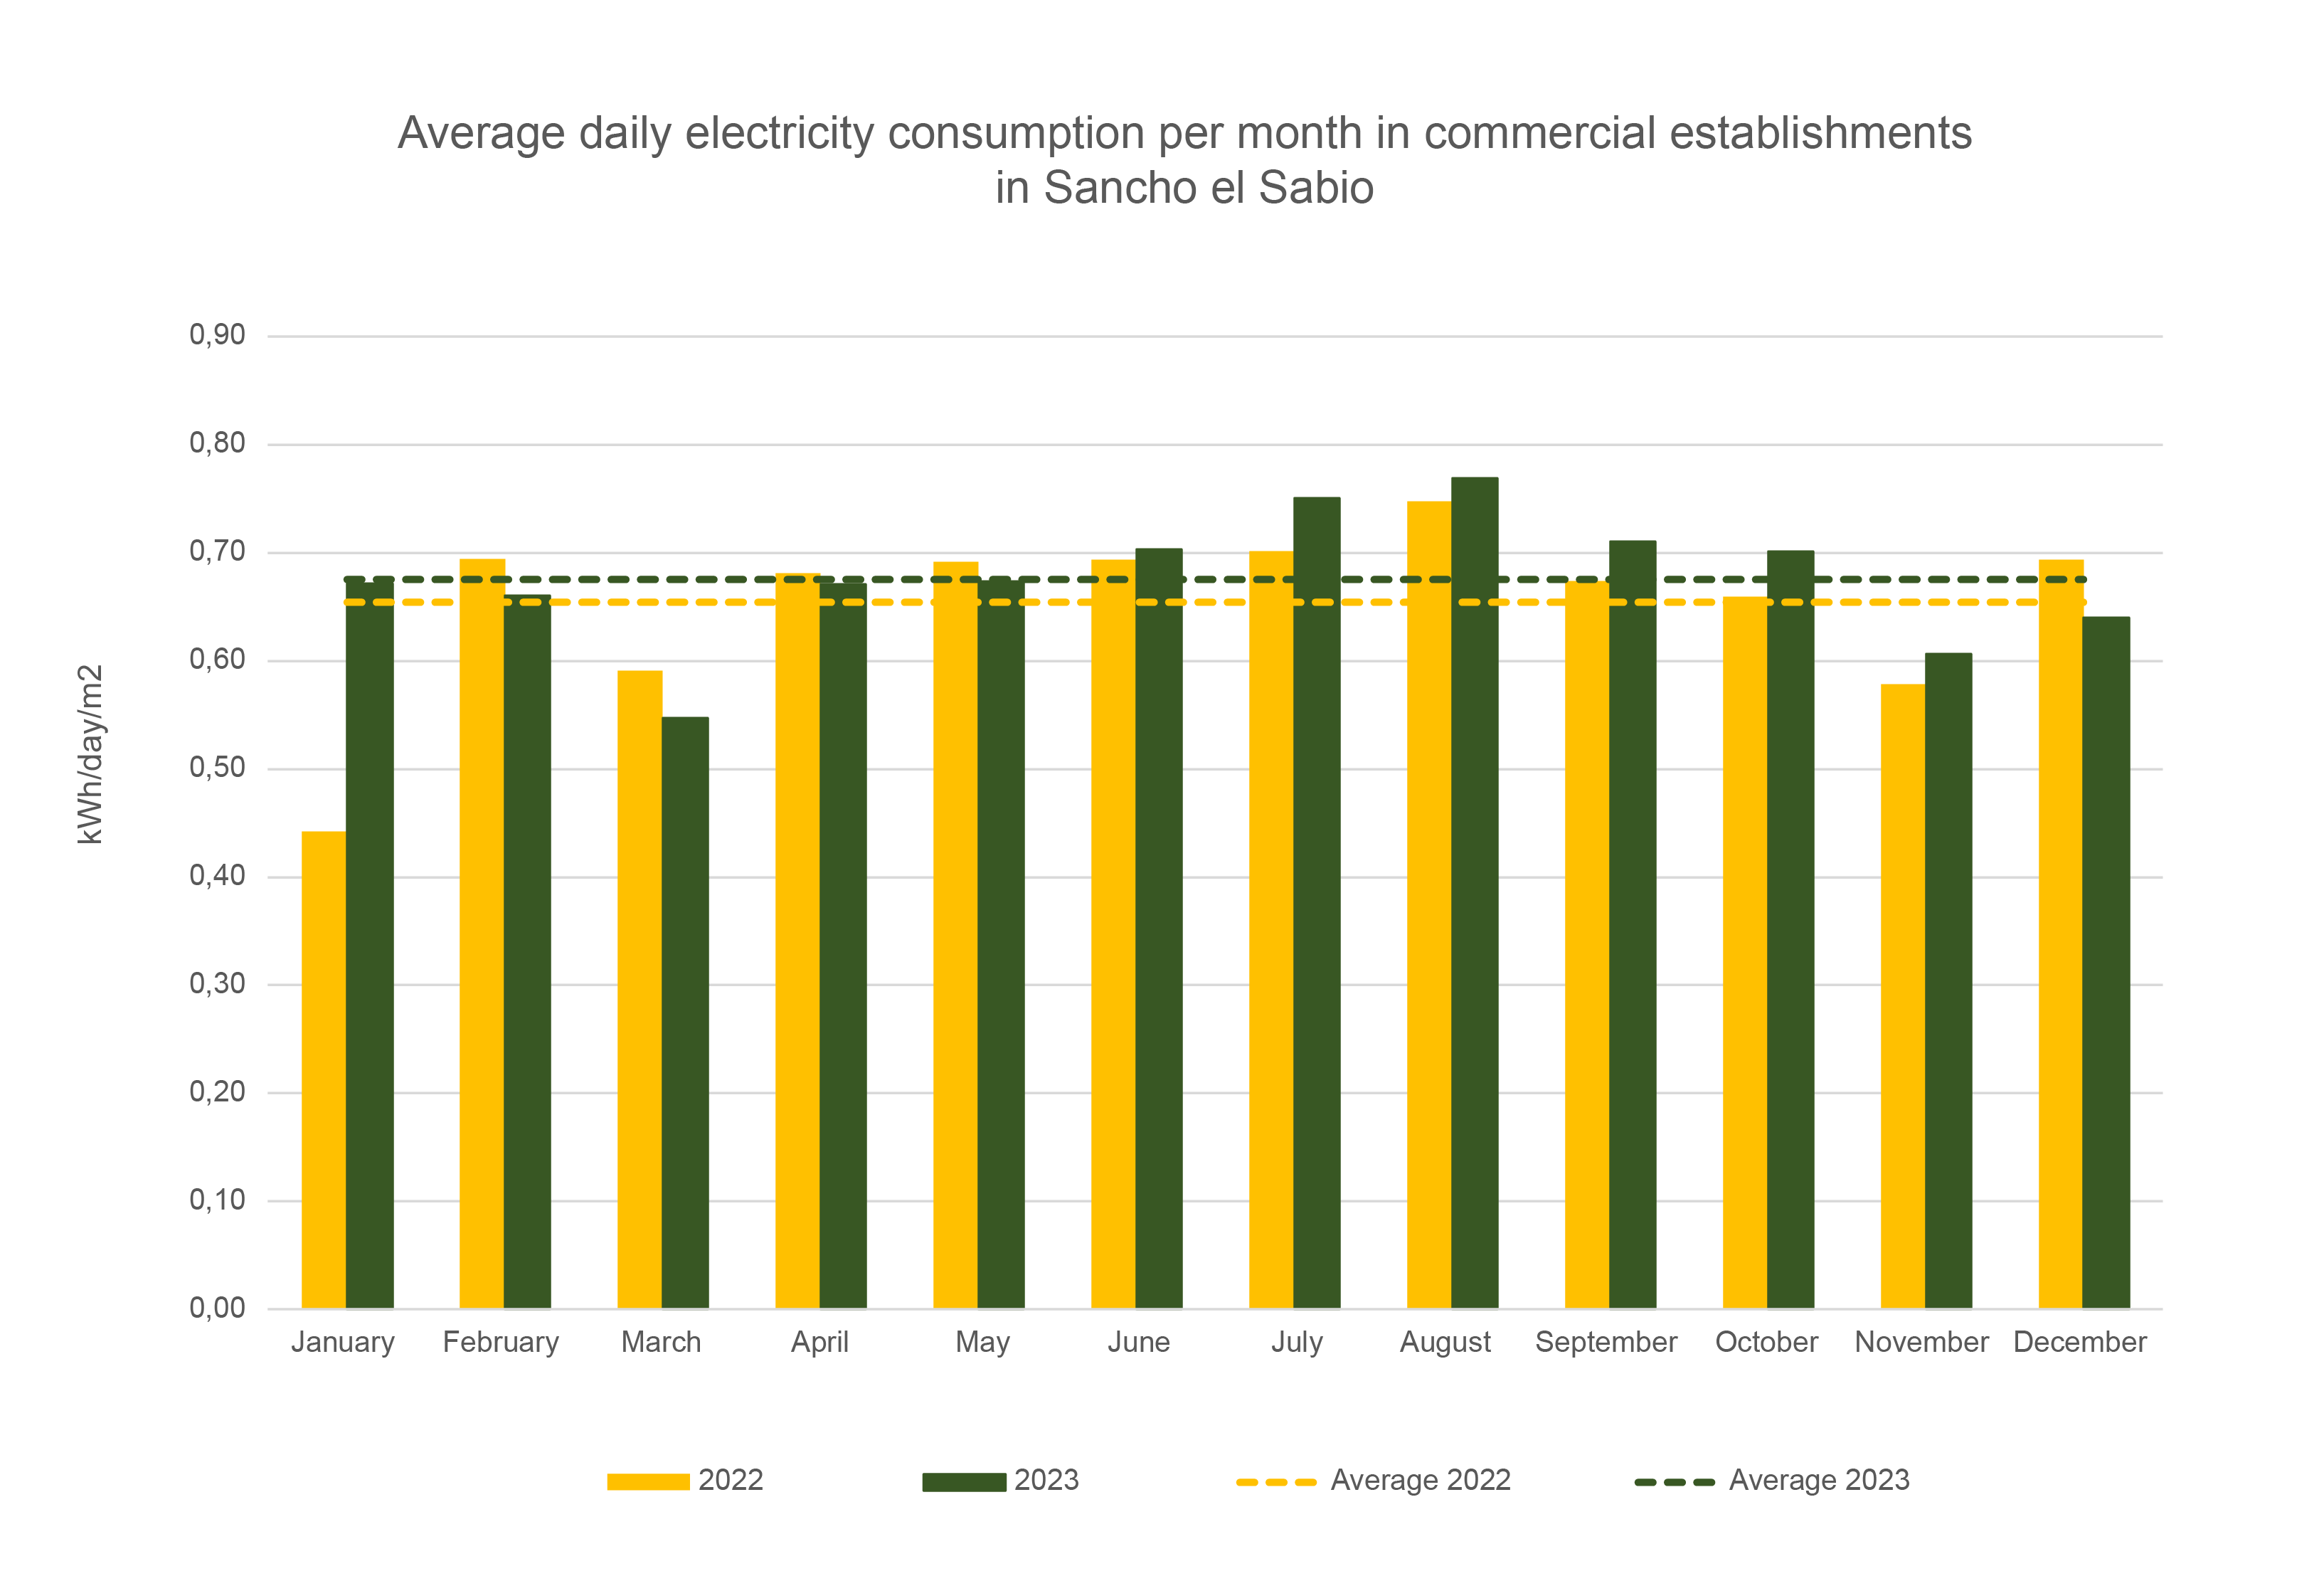
Average daily electricity consumption per month in commercial establishments in Sancho el Sabio
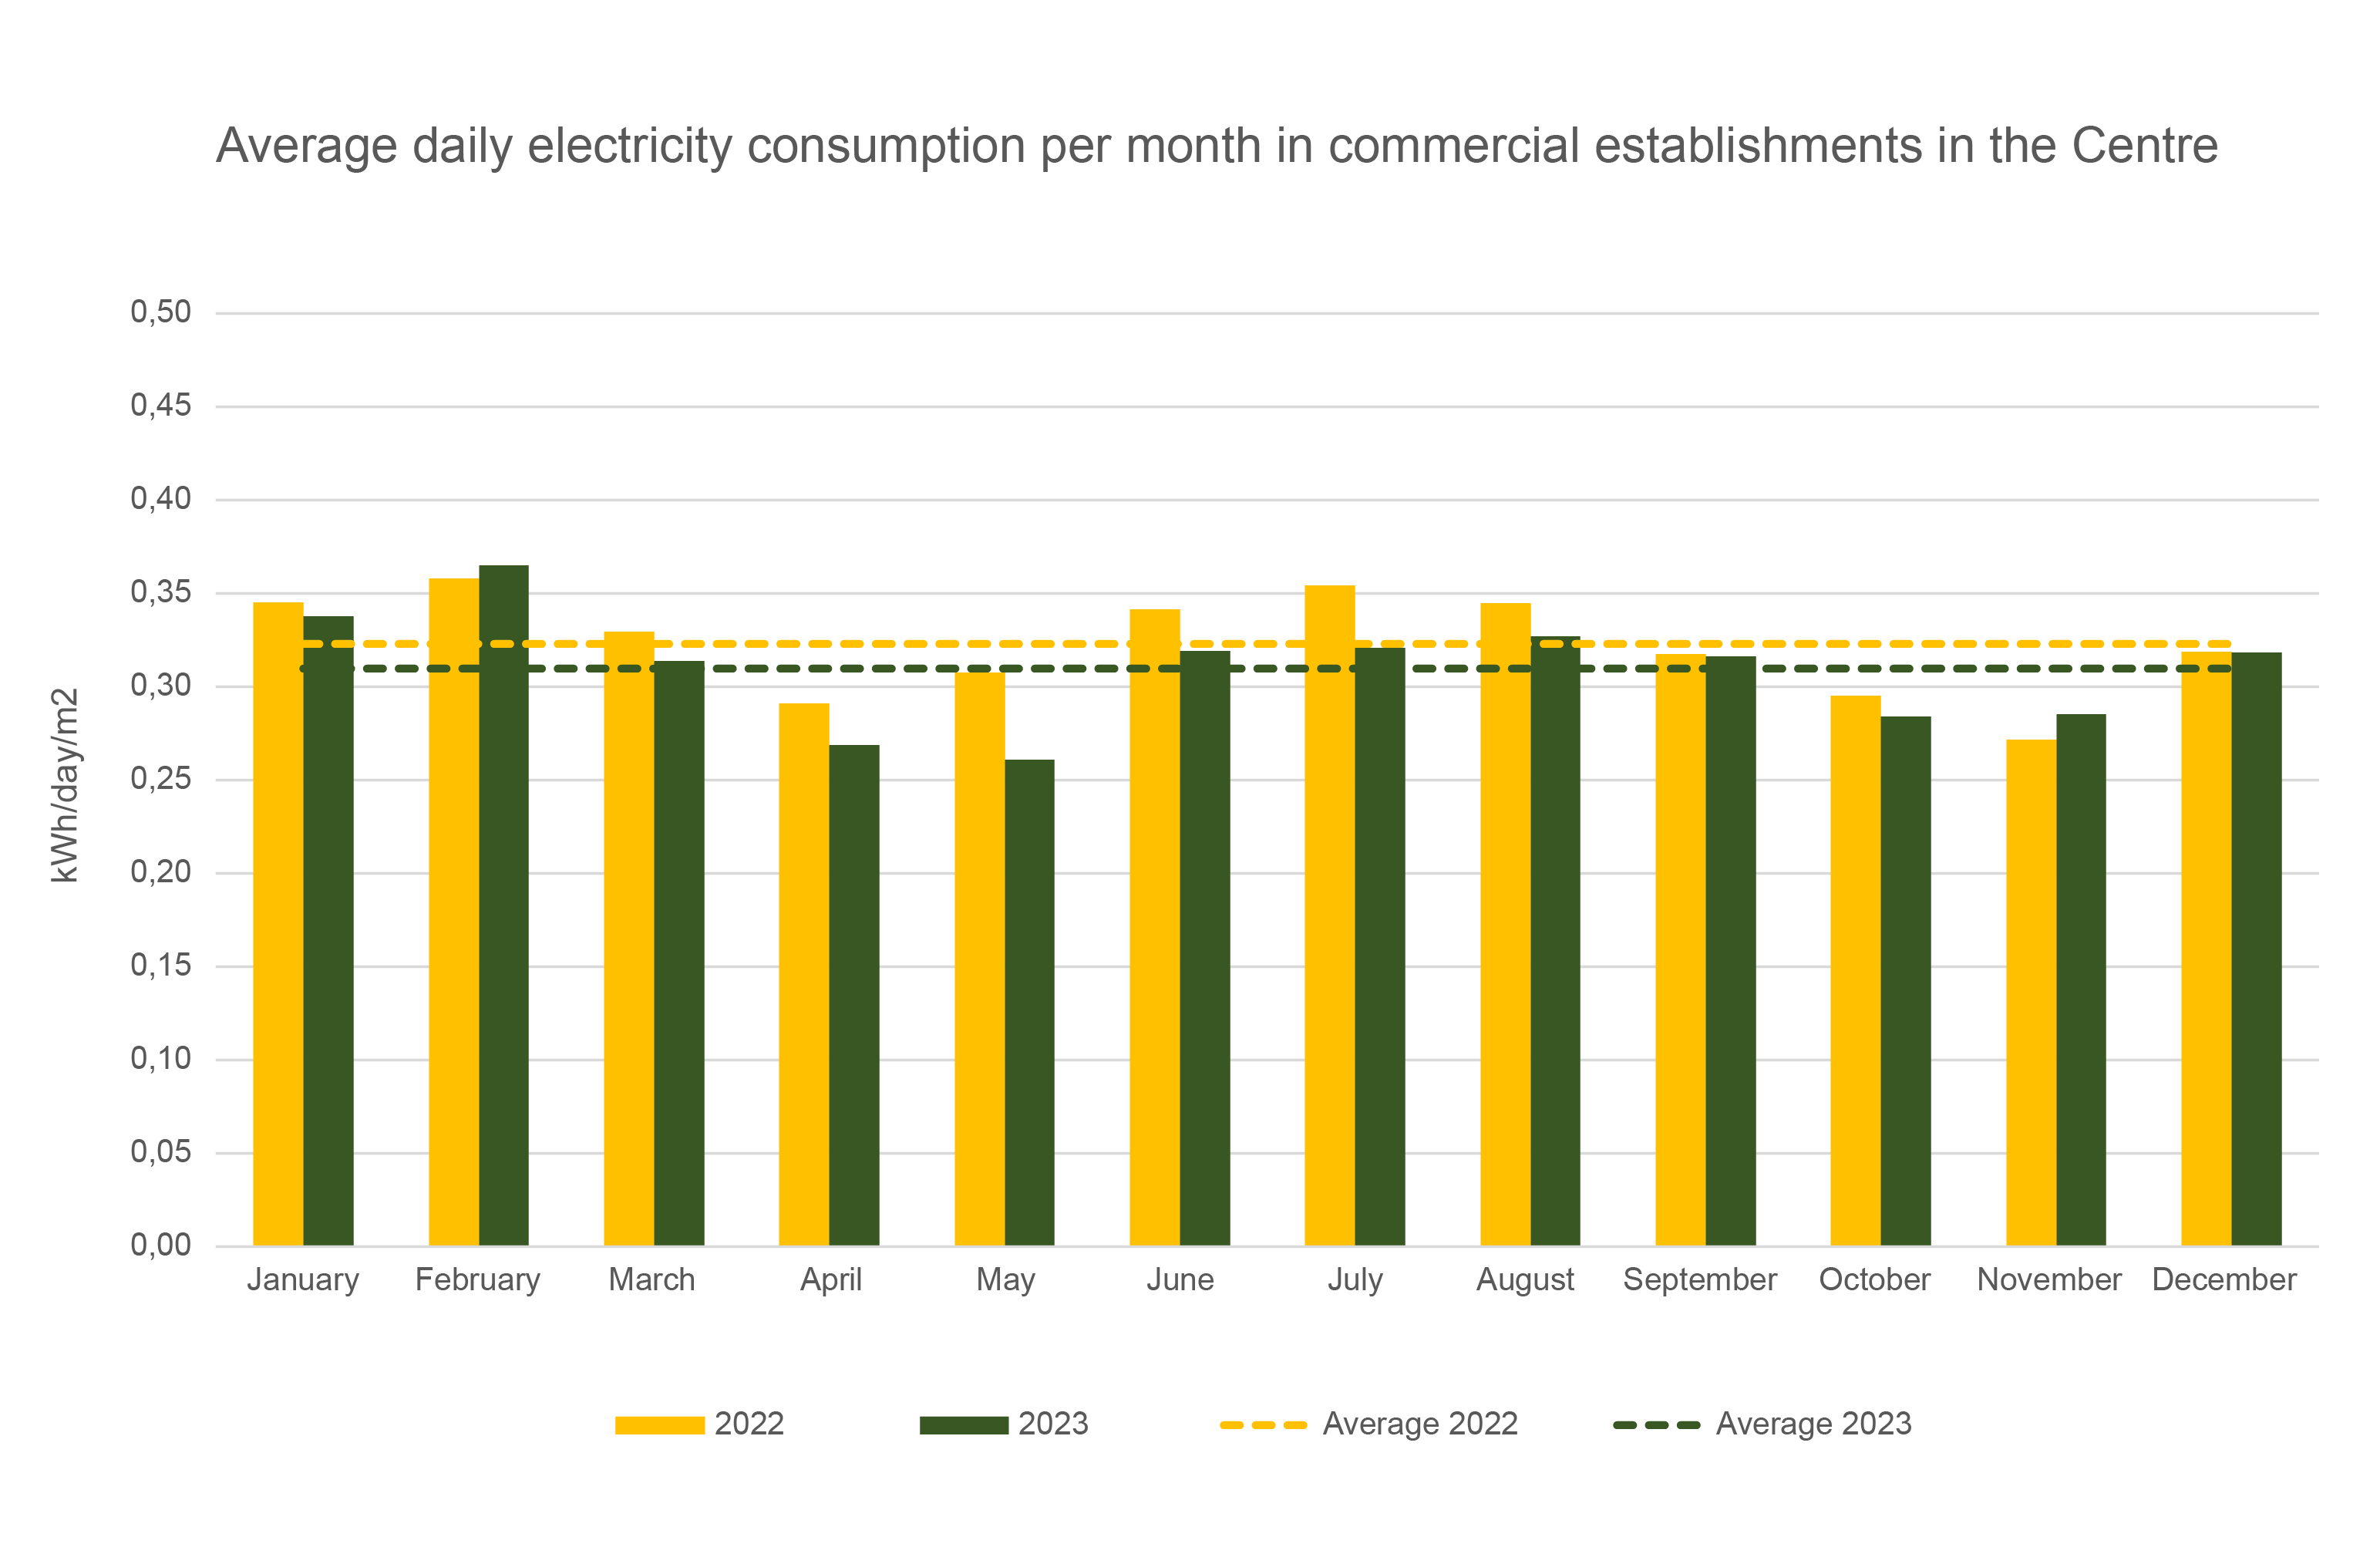
Average daily electricity consumption per month in commercial establishments in the Centre
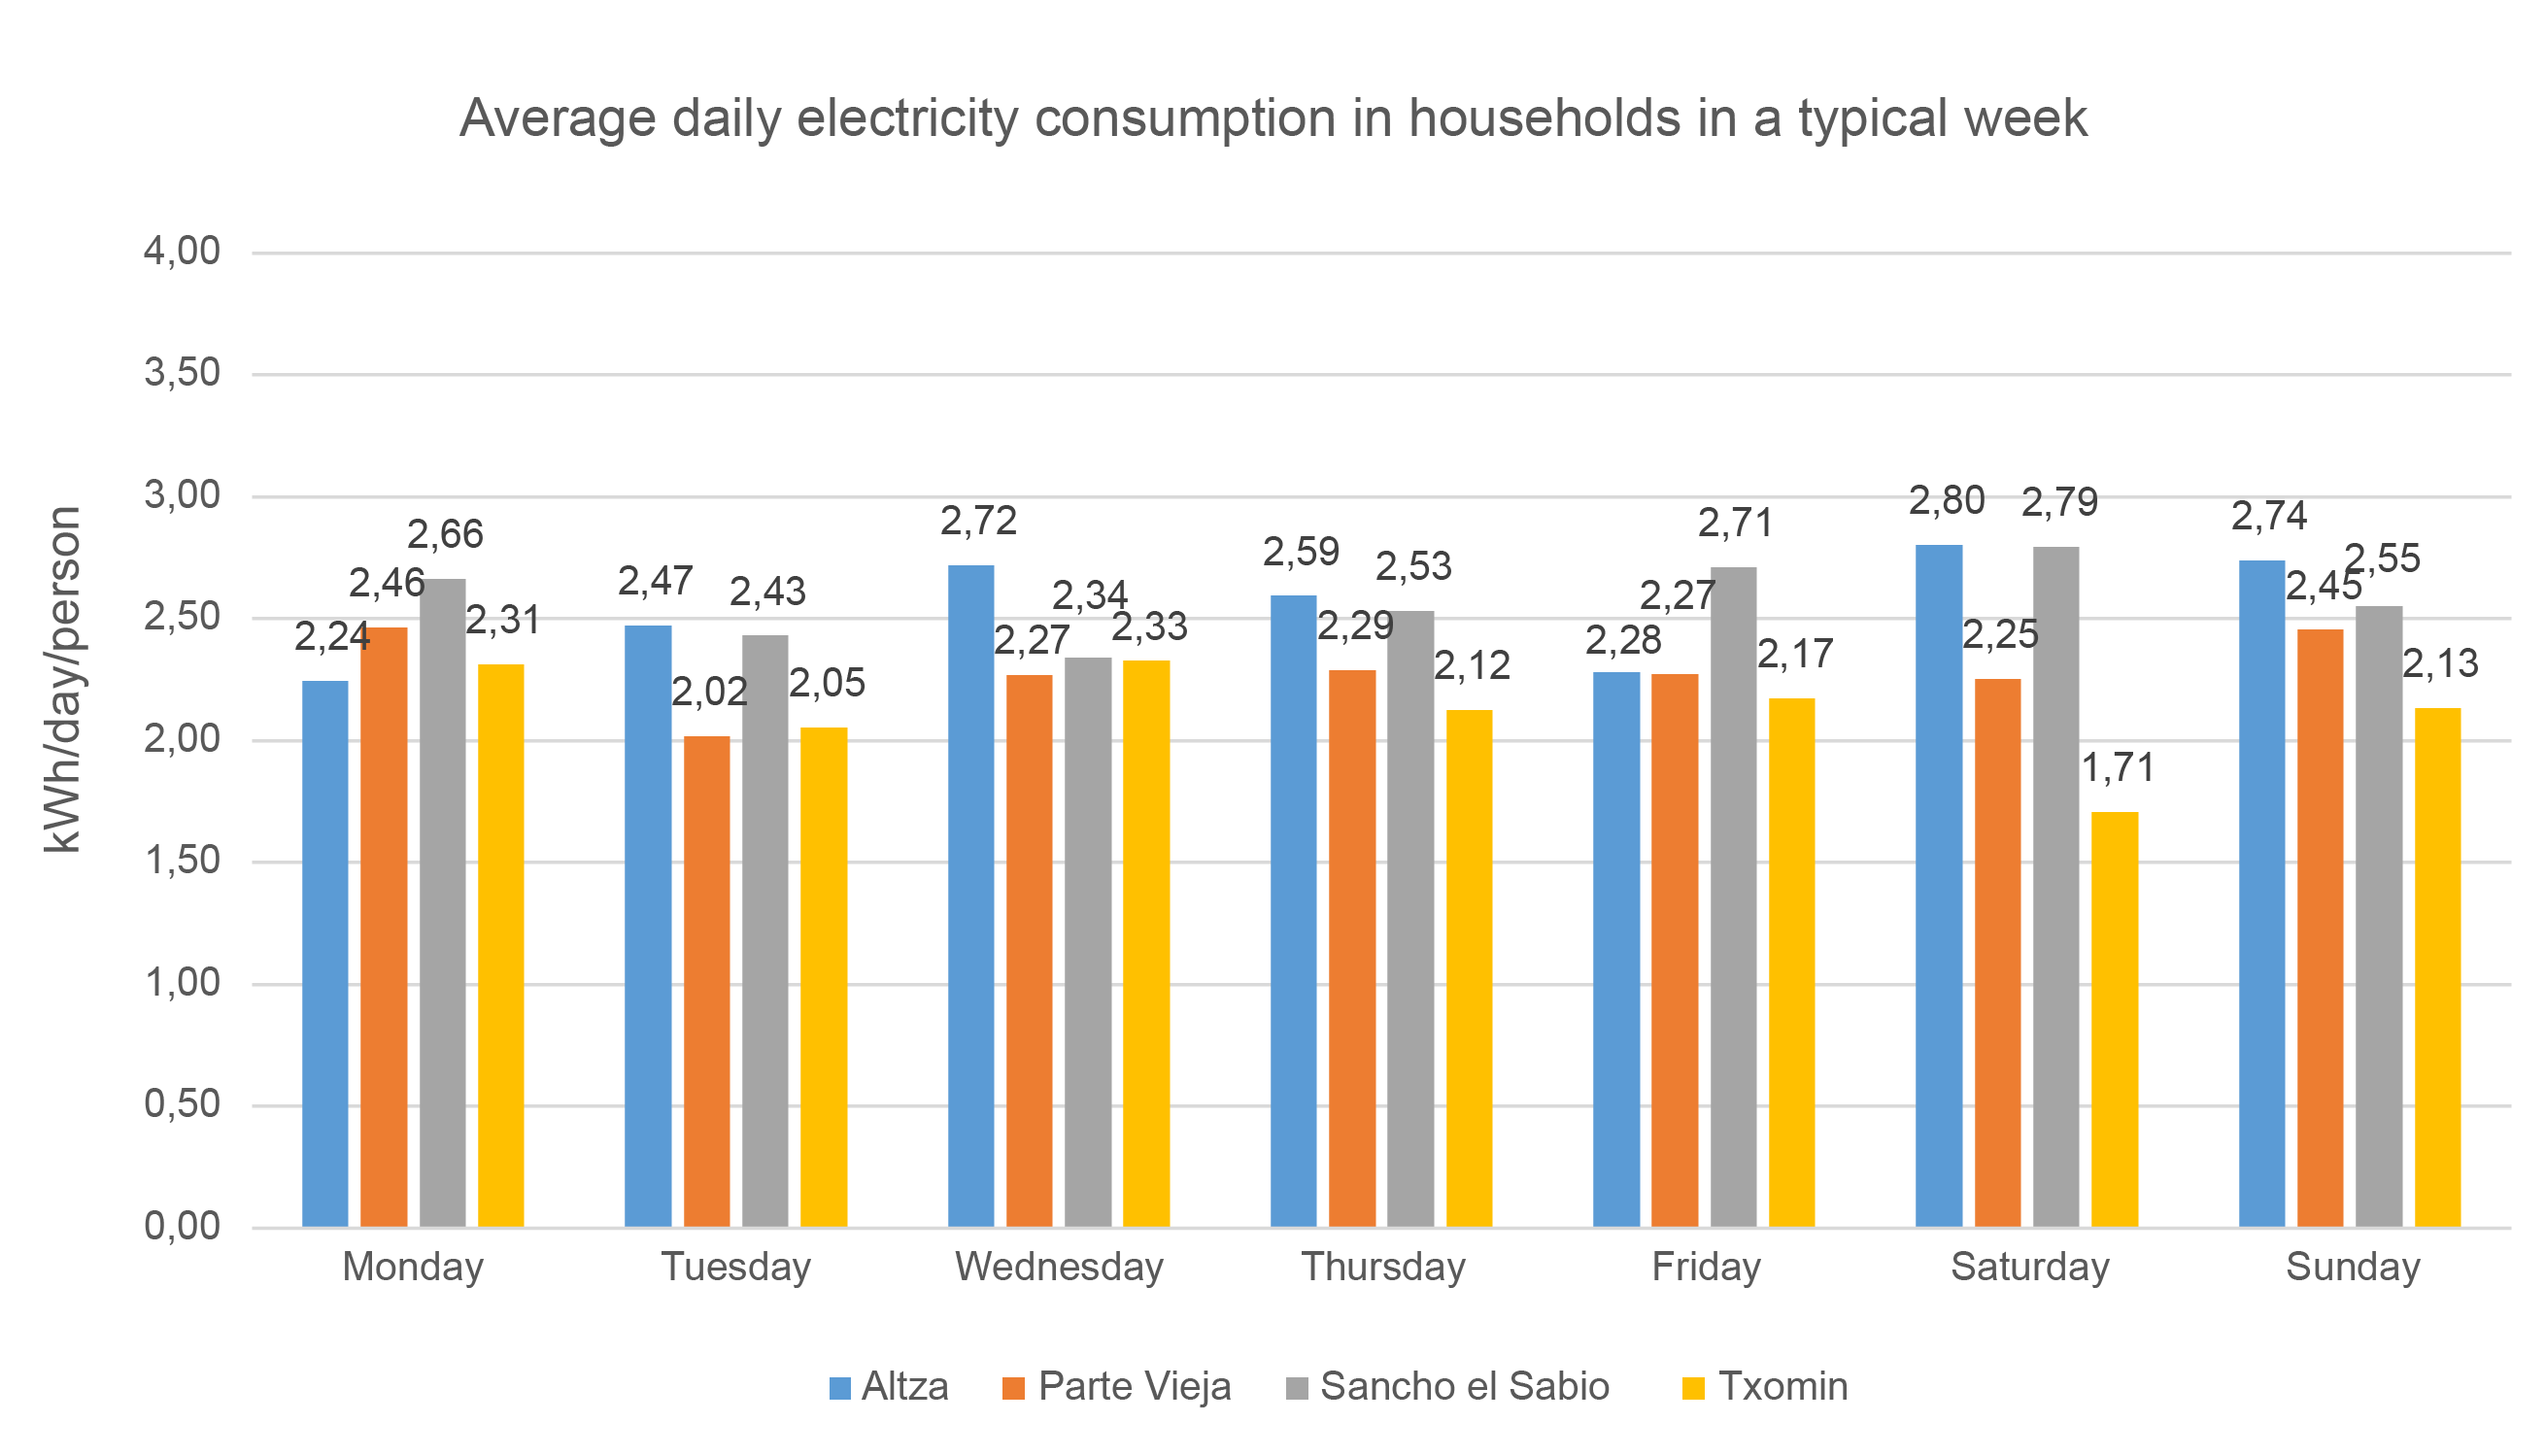
Average daily electricity consumption in households in a typical week
Advice on how to save on your electric bill
- Use appliances like the dishwasher or the washing machine when they are fully loaded. If you also use energy saving programs or cold cycles, it will reduce the amount of electricity they use.
- Turn off the TV, computer and other appliances completely. Having them in stand-by mode is an unnecessary expense.
- Unplug the computer and mobile chargers when the battery is charged. If you use a power strip, you will only have to switch off one switch to completely turn them off.
 Shops (download PDF)
- Check the amount of power you have contracted, if it is higher than what you use, it will mean paying more at the end of the month.
- Wait for the food to cool down before you put it in the refrigerator. Putting food that is not cold into the fridge makes the fridge work harder, so it consumes more electricity to keep everything cold, and also shortens its lifespan.
- If you are buying a new appliance, chose energy efficient appliances (A, A+, A++). Even though they cost more in the start, they’ll save you monthly on utility bills.
Homes (download PDF)
What has been measured?
The smart platform has been used to monitor water consumption in households, shops, bars and restaurants involved in the SmartKalea project. This platform has collected daily water consumption figures anonymously, thereby making it possible to analyse it.
Measured data
What district?
Observations
%
15
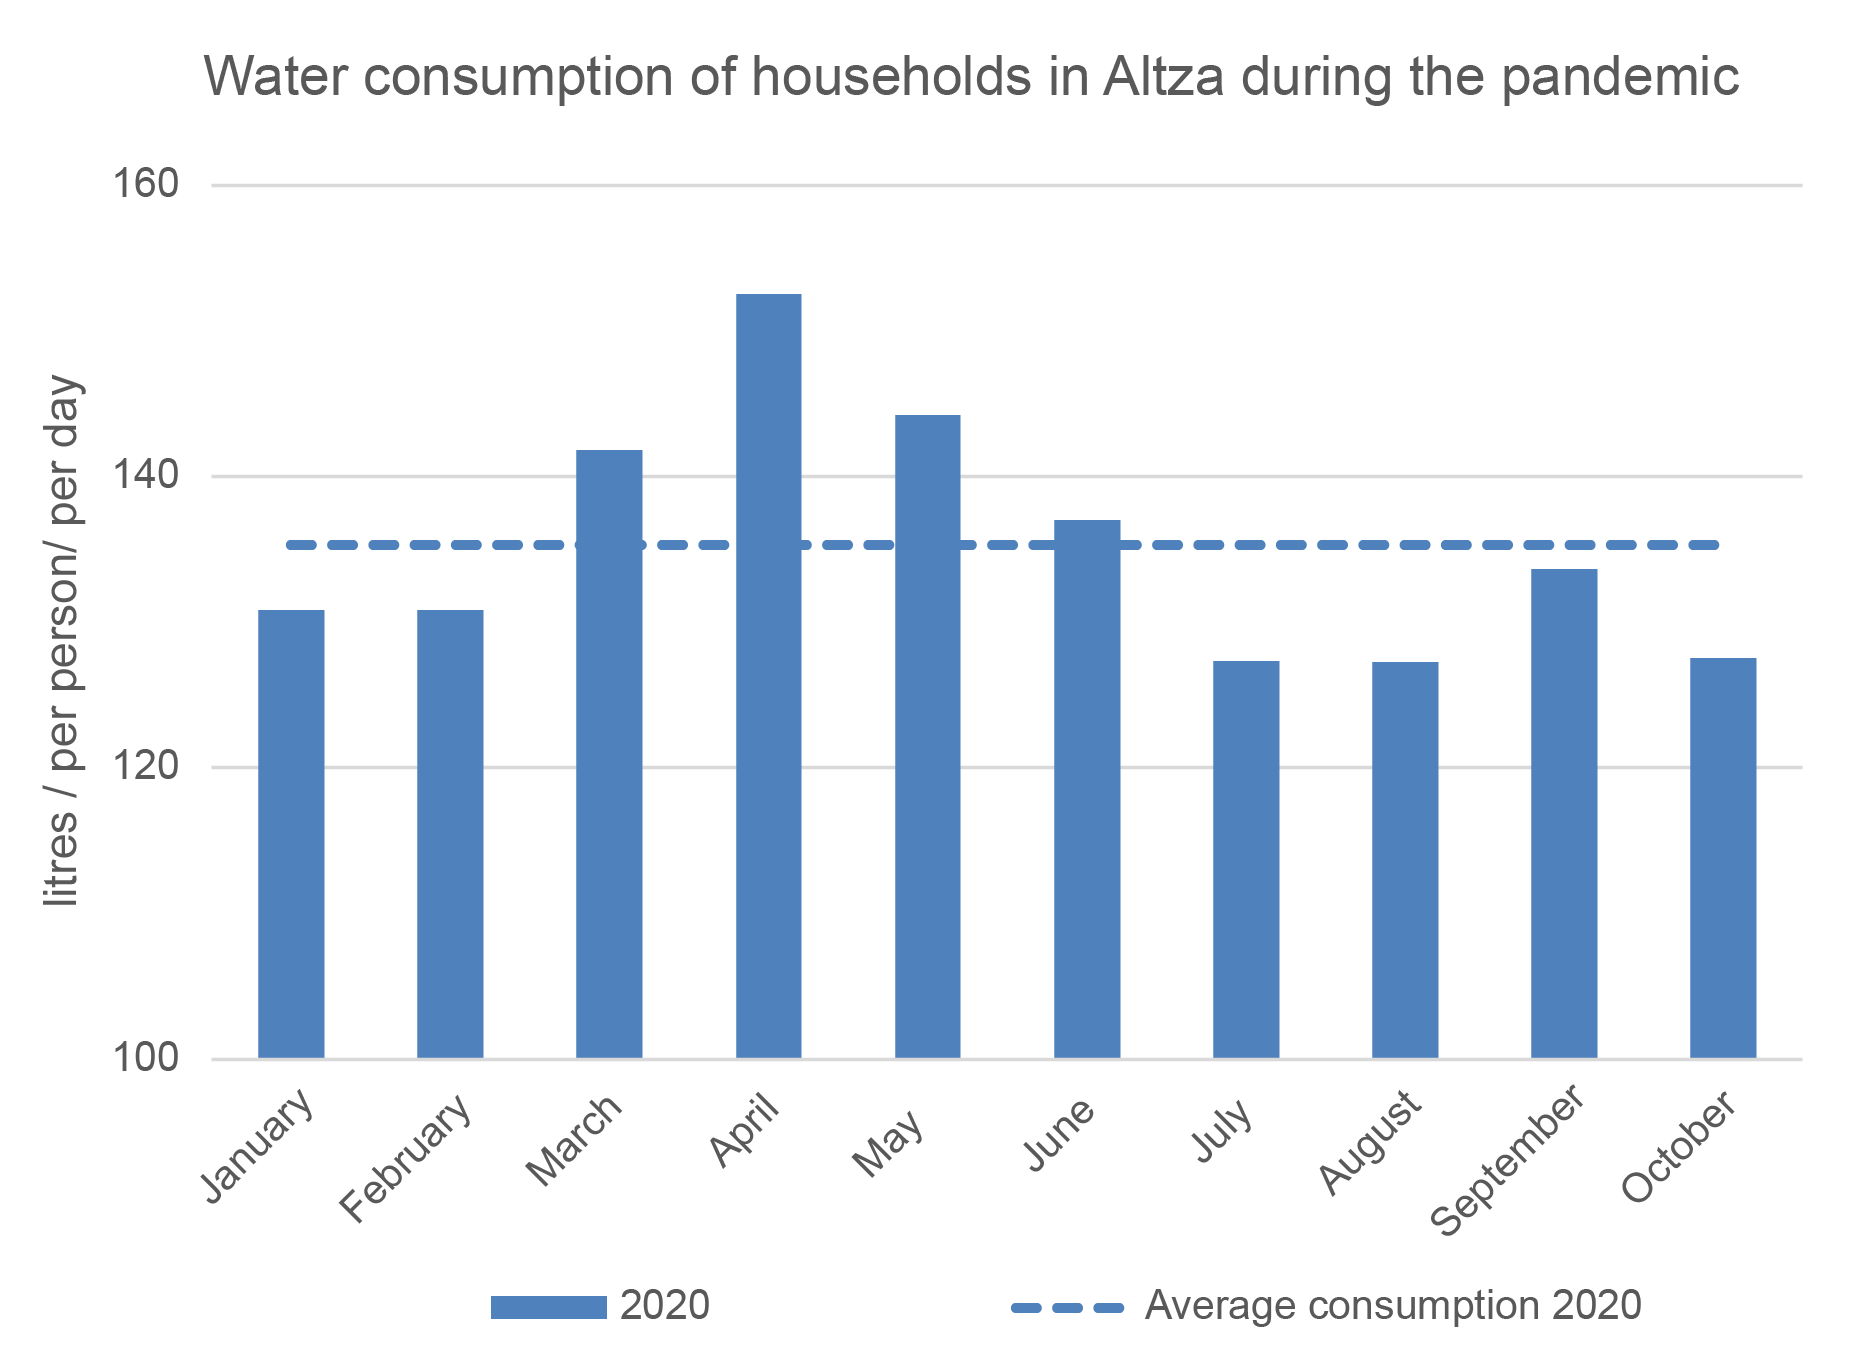
%
the average household water consumption during confinement
%
80
%
the average water consumption in commercial establishments during 2020 compared to 2019
Water consumption per capita around the world
Check out the water consumption per capita in different regions of the world. Please keep in mind that these data cannot be directly compared, since water consumption is locally affected by climate, social, cultural and economic variables.
Daily water consumption in litres per capita (L/c/d)
Sources
http://waterstatistics.iwa-network.org/graph/14

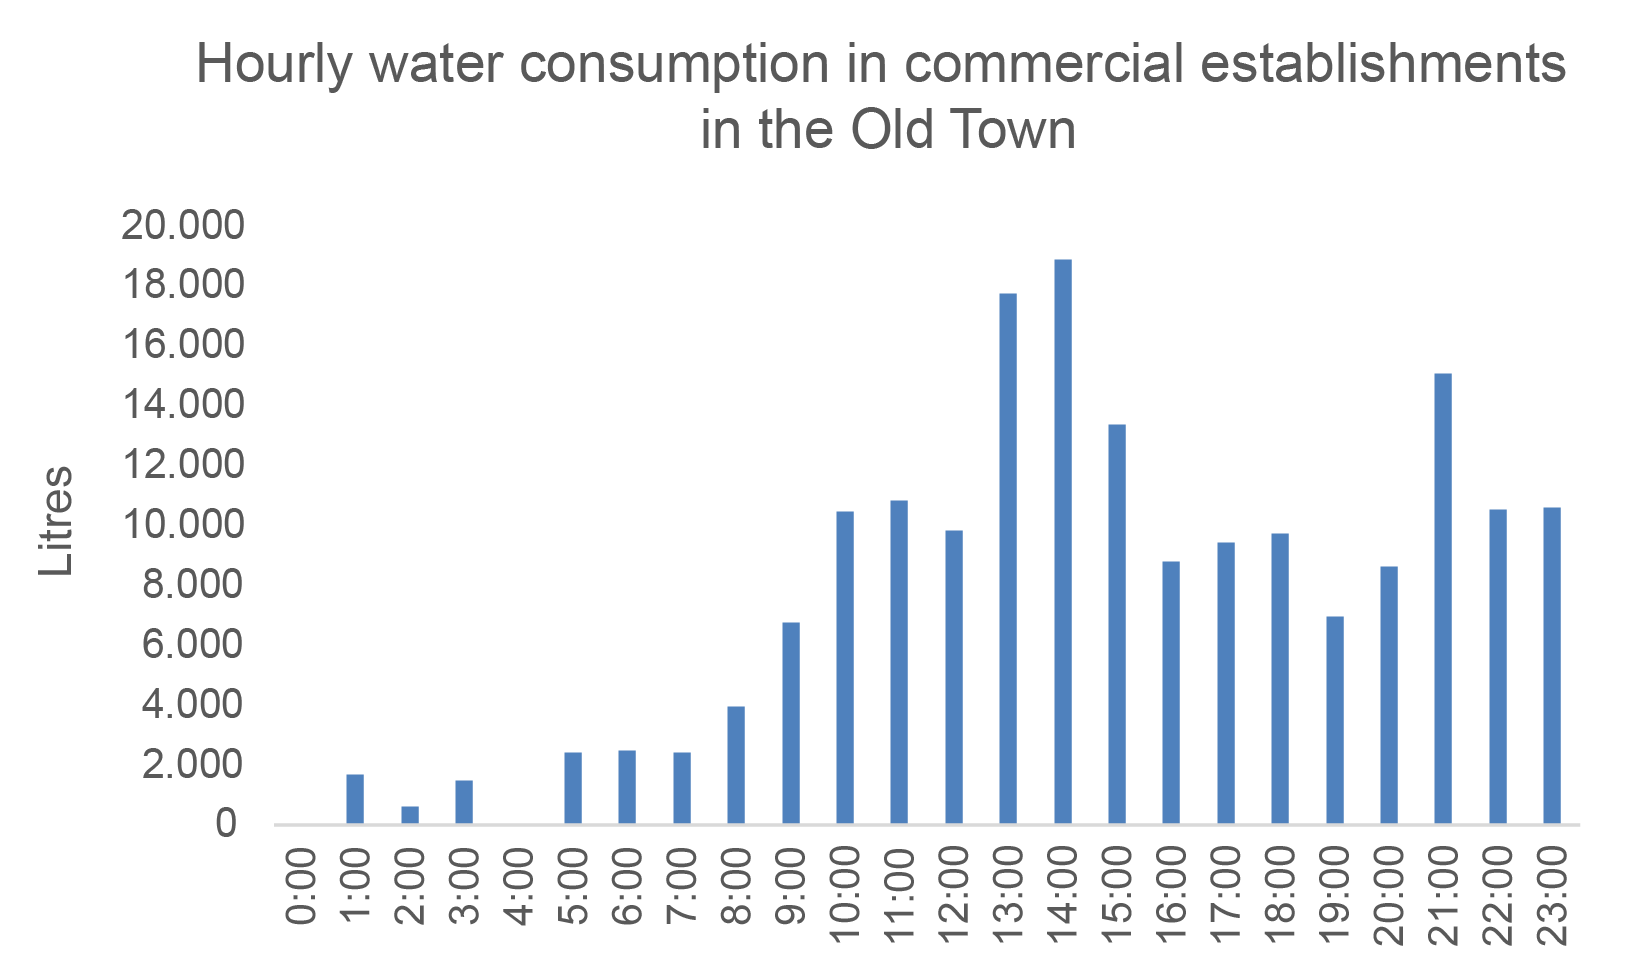
Hourly water consumption in commercial establishments in the Old Town
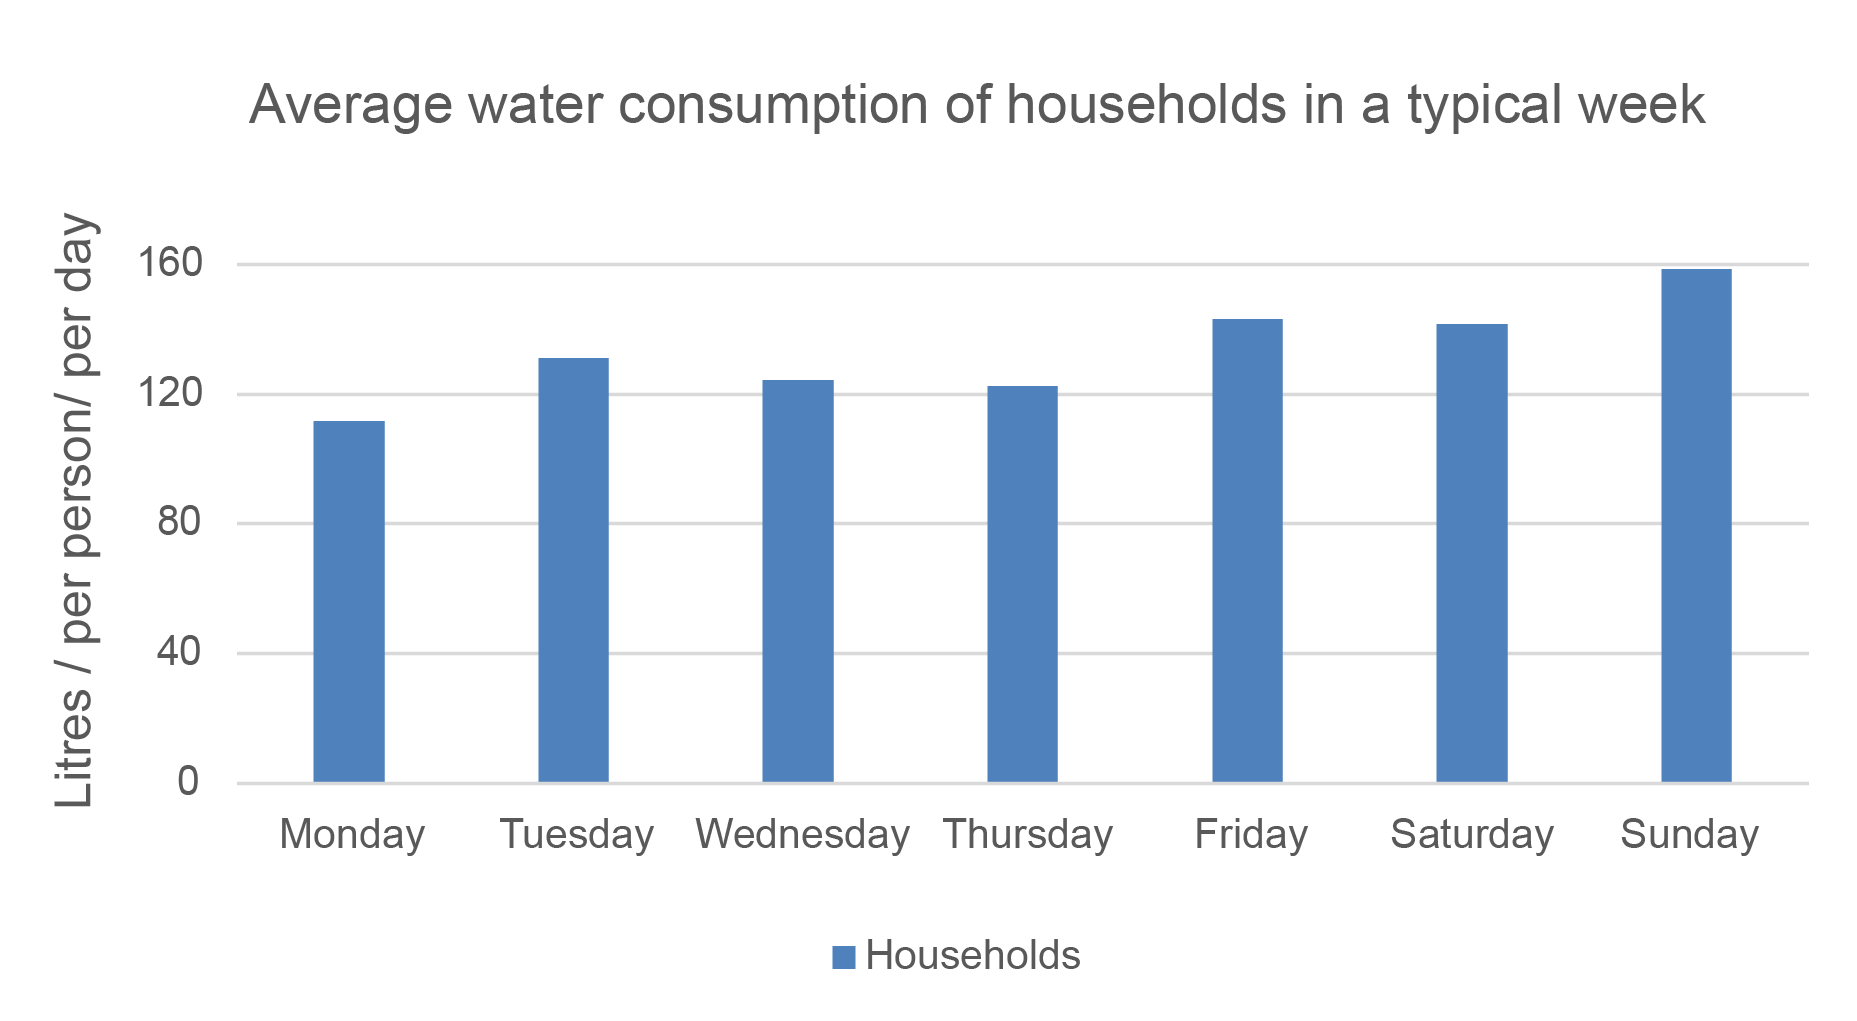
Average water consumption of households in a typical week
Water consumption of households in Altza during the pandemic
Advice on how to save on your water bill
- Put a trash bin in the bathroom, it will stop you from using your toilet as a trash can.
- Make sure you fully load the dishwasher and the washing machine and select the proper cycle.
- If you have a garden or plants, water them in the morning or at night to avoid the water evaporation before it is absorbed.
Shops (download PDF)
- Make sure your faucets do not leak and that they are closed properly.
- Install a faucet aerator and switch to low flow shower heads. They mix water with air to give you more volume with less water usage.
- Remember to turn the water off while you brush your teeth, shave or lather up.
Homes (download PDF)
Did you know that...?
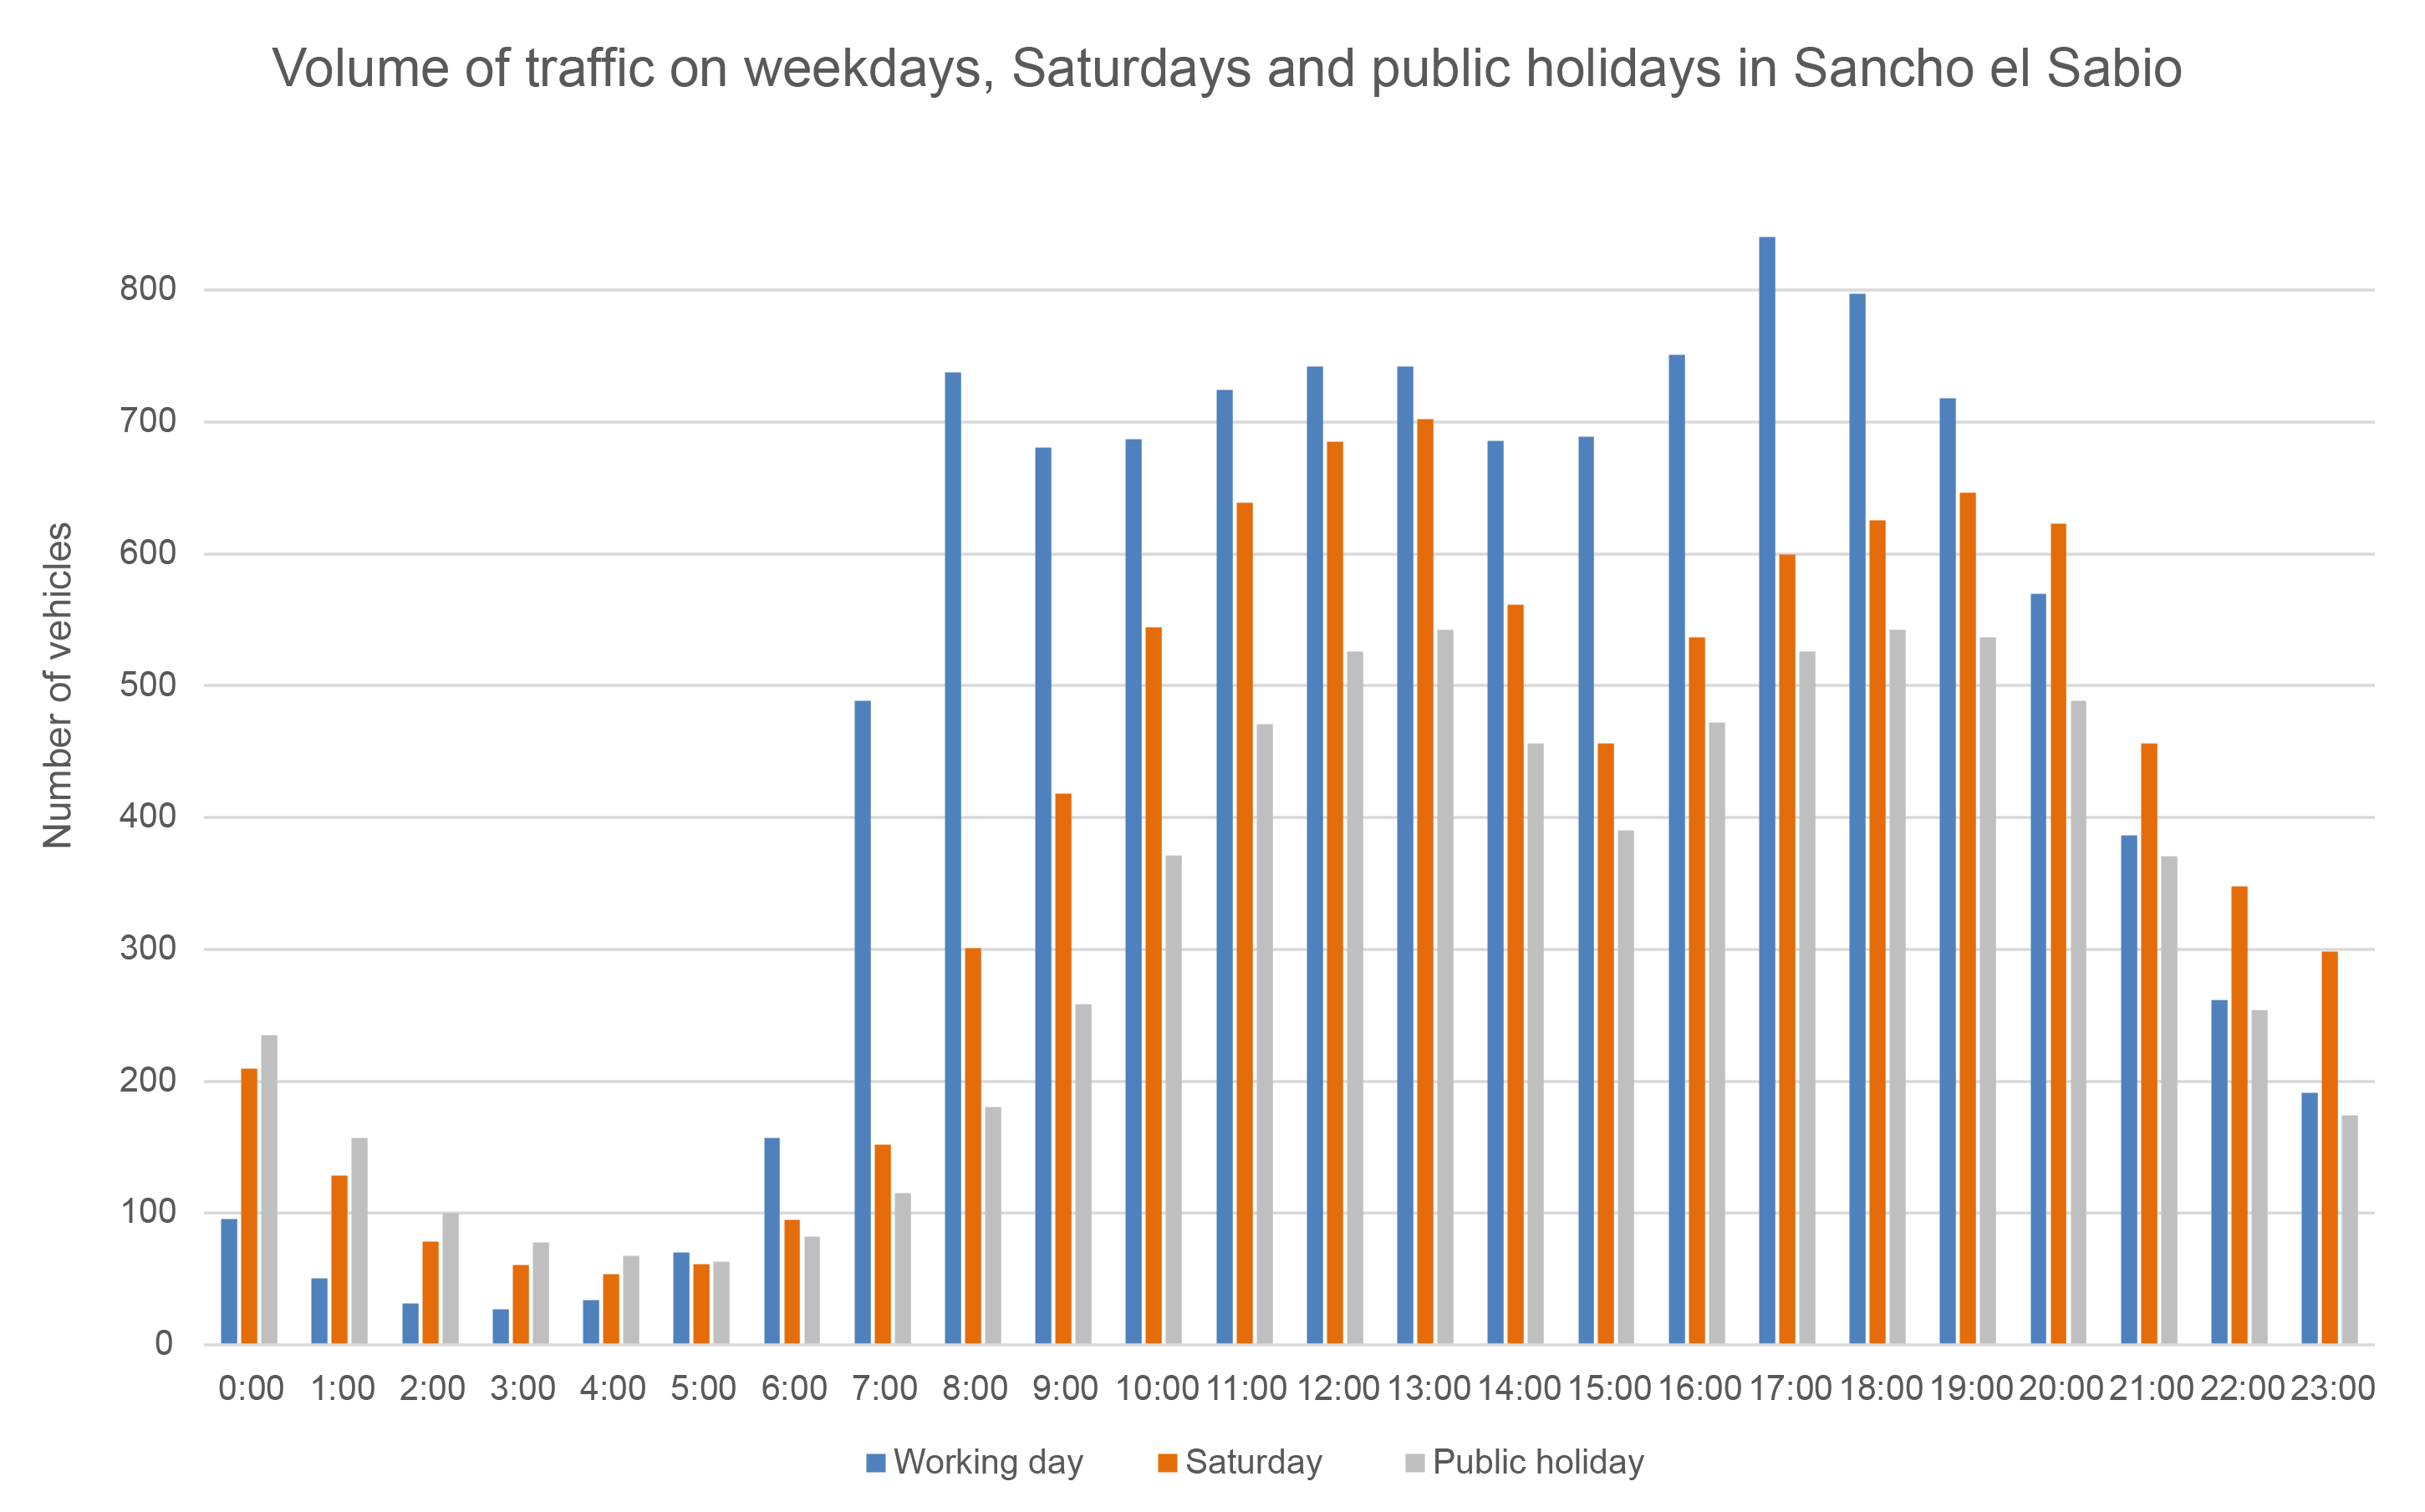
Counting sensors installed in the areas of the Old Town, the Centre, and the neighbourhoods of Sancho el Sabio, Altza and Txomin-Enea have monitored the flow of traffic through the following streets: Mayor, Narrika, Puerto, San Jerónimo, 31 de agosto, Fermín Calbetón, San Lorenzo, Iñigo, Sancho el Sabio, Paseo de Altza, the roundabout giving access to Txomin, Kristobaldegi, Goiekoenea, Paseo de Antzieta, Easo, San Martín, Pedro Egaña and Peñaflorida.
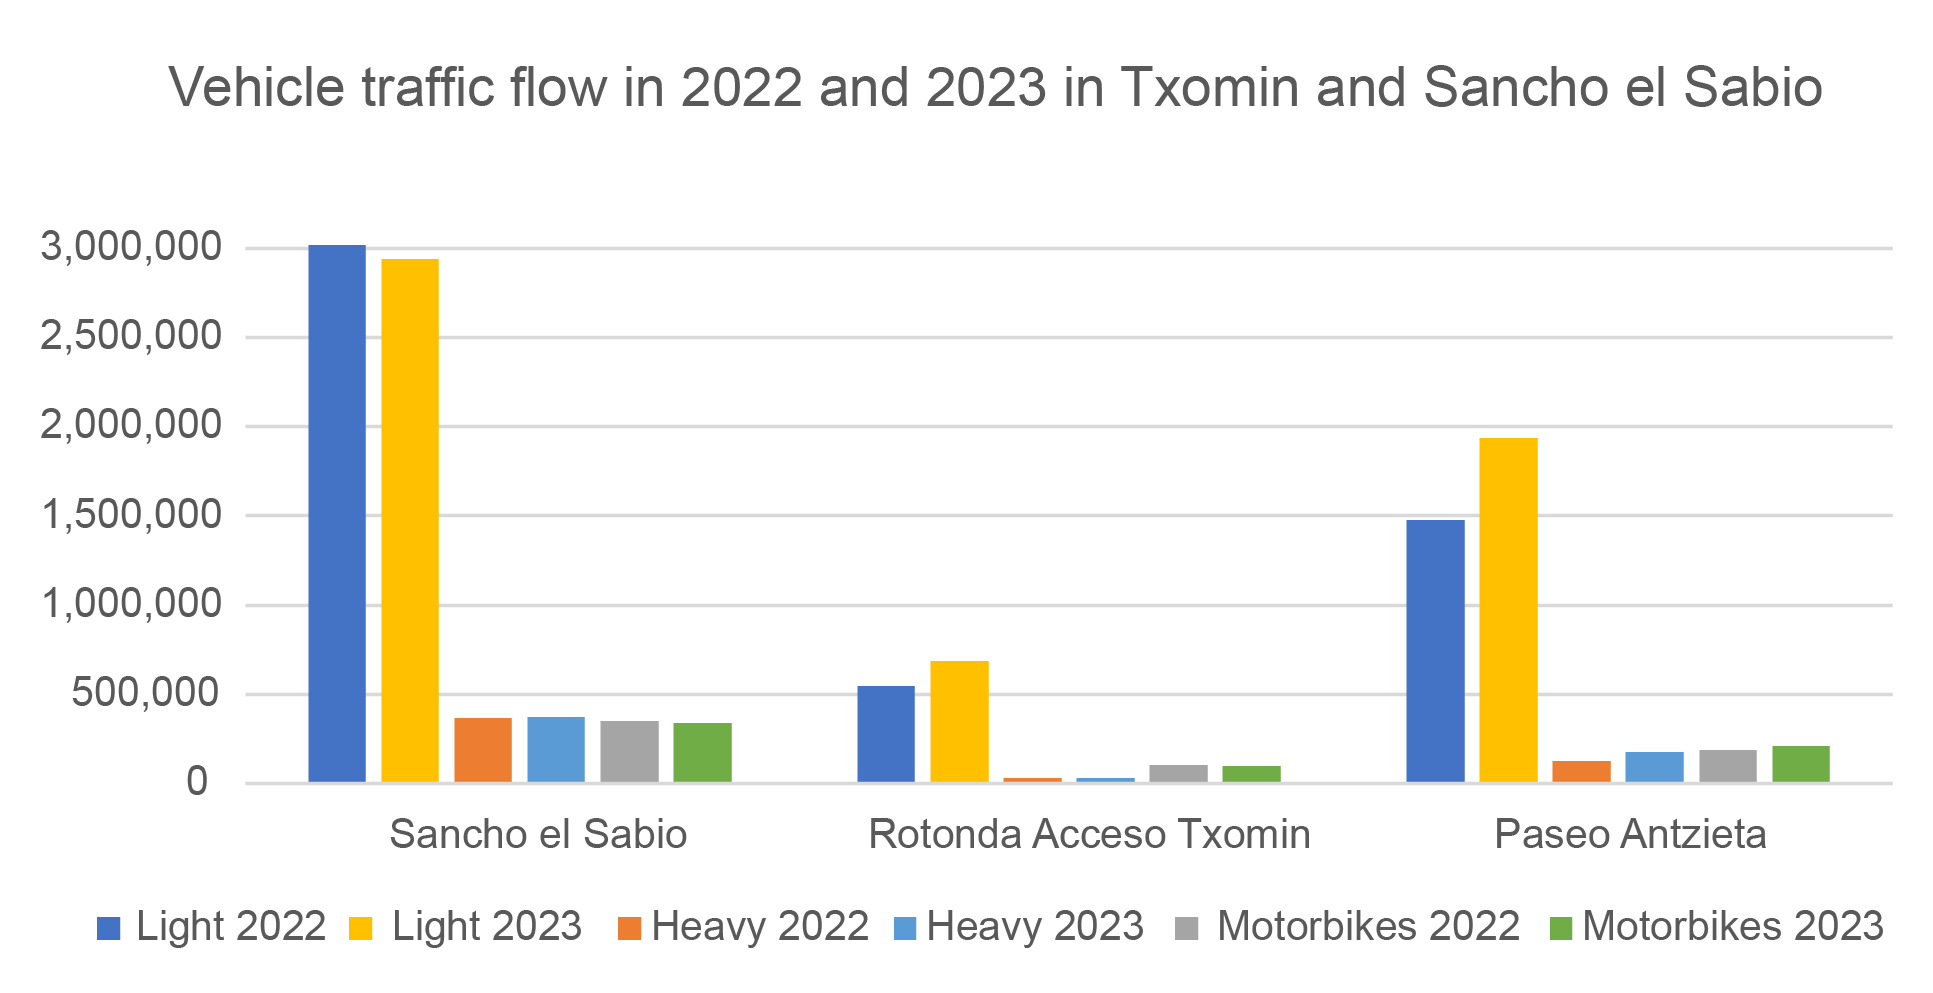
The number of vehicles in Sancho el Sabio and Txomin neighbourhoods, the number of bicycles in the Centre and Txomin neighbourhoods, and the number of Euskotren passengers in Altza have been monitored in other mobility areas.
Measured data
What district?
Pedestrians
0
pedestrians
Vehicles
0
Information unavailable for this neighbourhood
Bicycles
0
bicycles
EUSKOTRAIN PASSENGERS IN ALTZA
0
passengers
Vehicles
0
vehicles
Bicycles
0
bicycles
EUSKOTRAIN PASSENGERS IN ALTZA
0
passengers
Special days
-
Business Day
-
Saturday
-
St Sebastian's Day
-
Virgin Mary's Day
-
Regatta day
-
St Thomas' Day
- Business Day
- Saturday
- St Sebastian's Day
- Virgin Mary's Day
- Regatta day
- St Thomas' Day
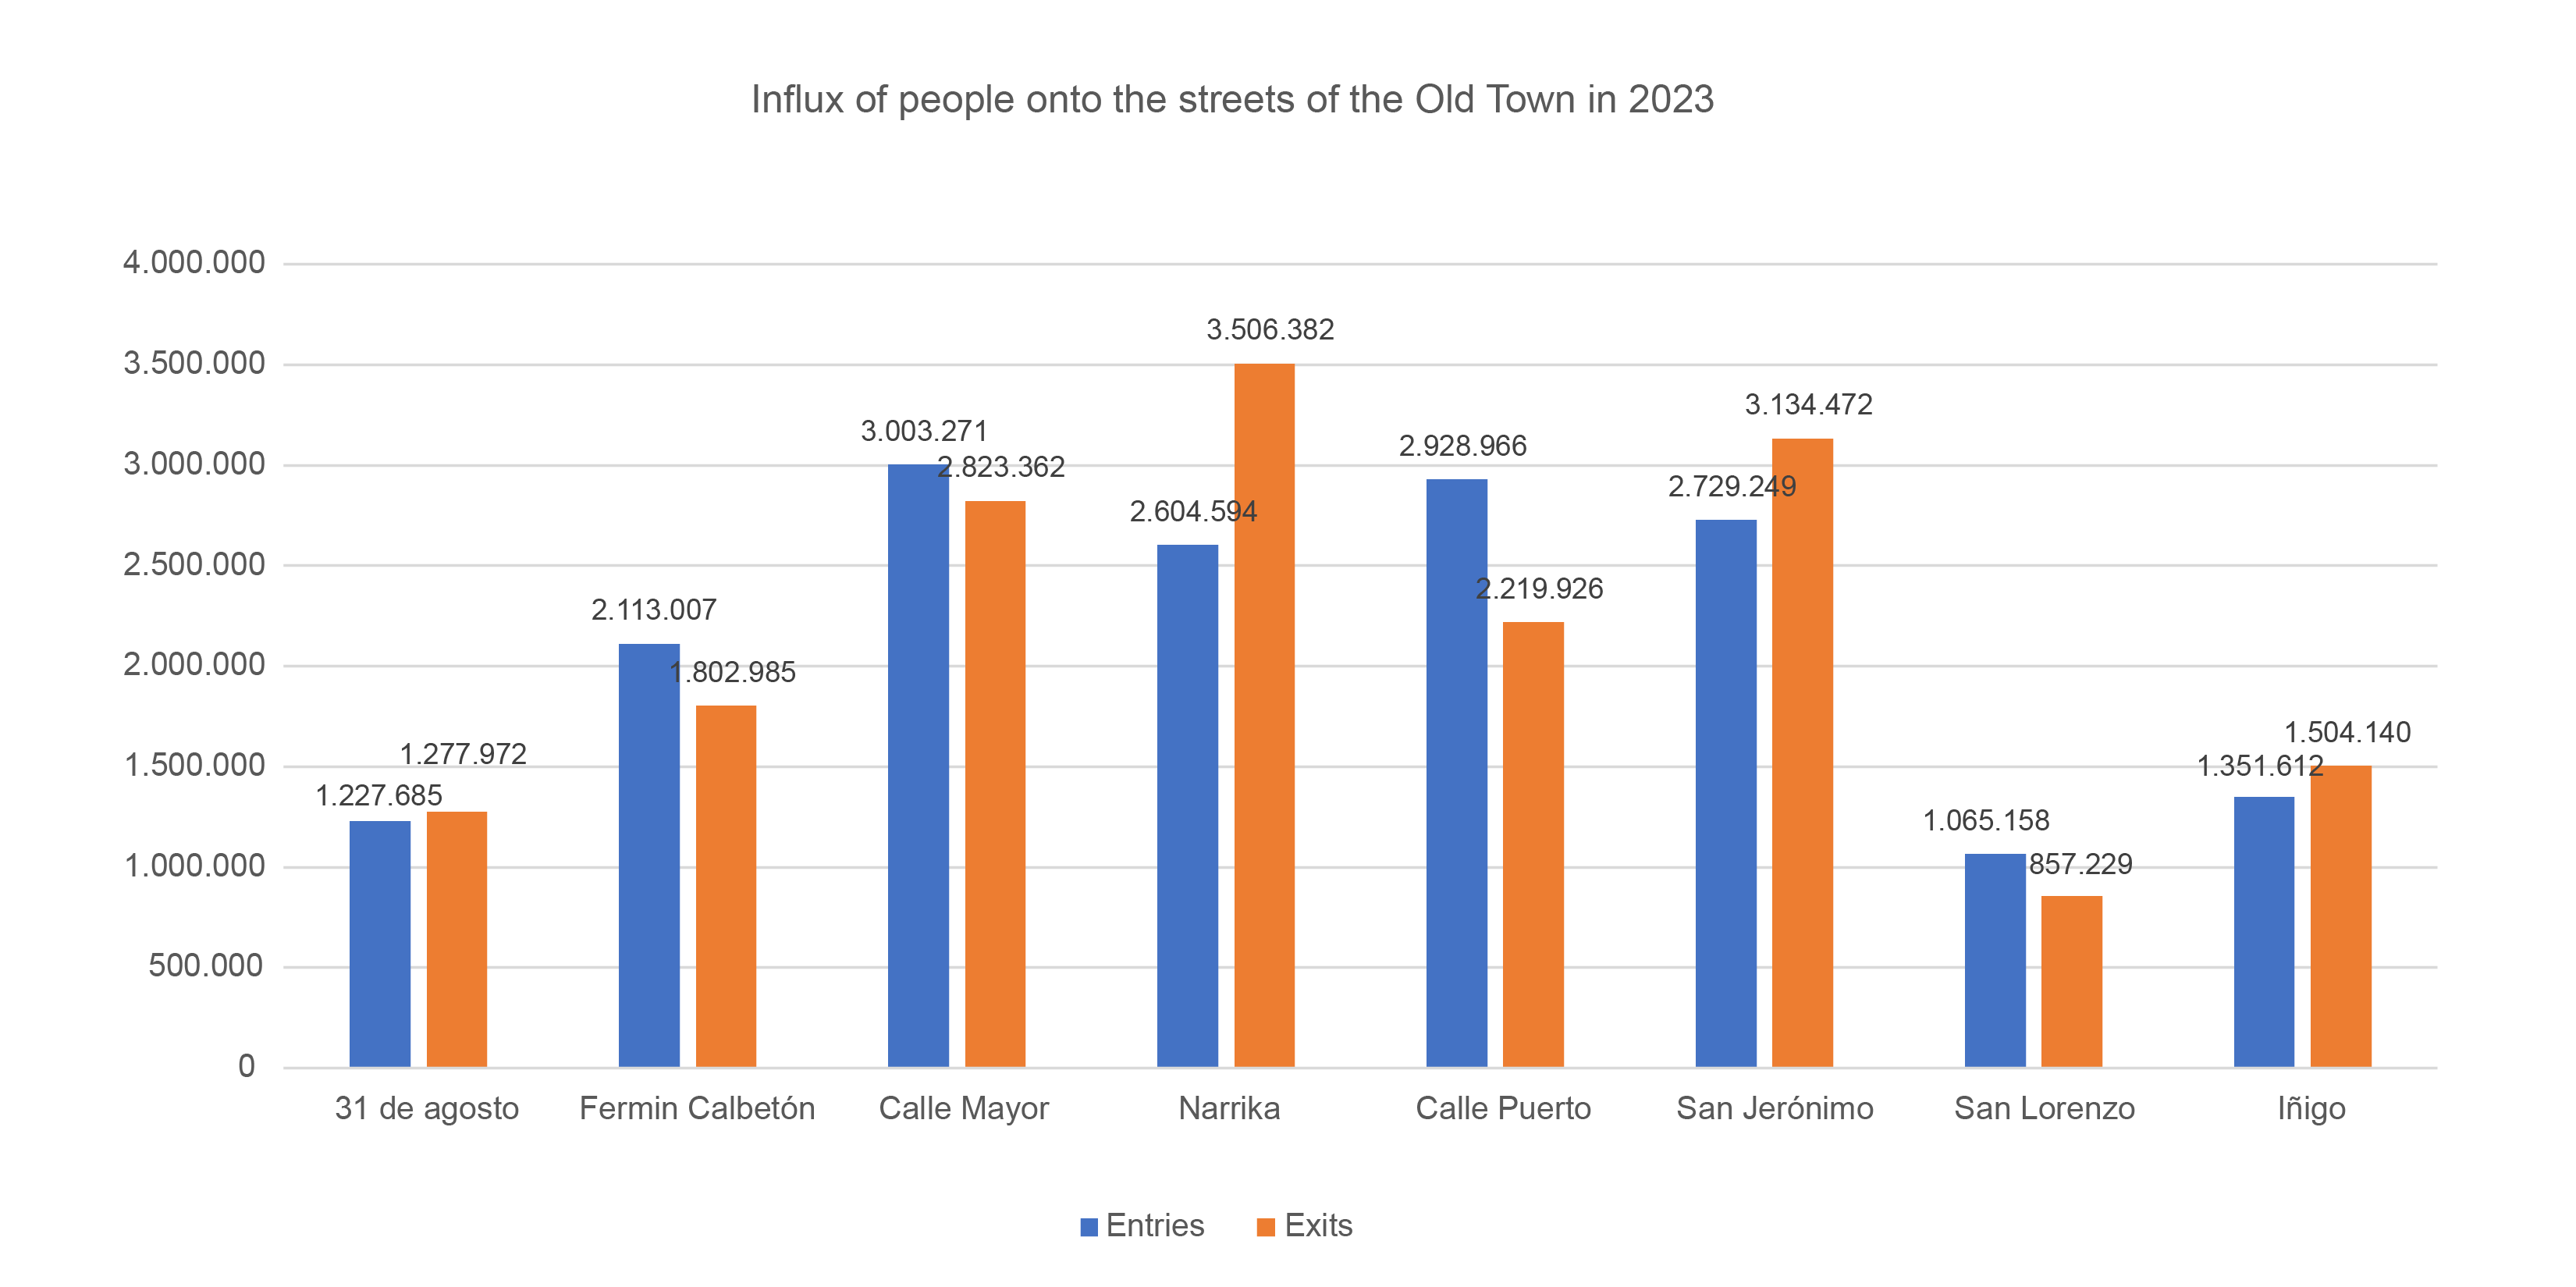
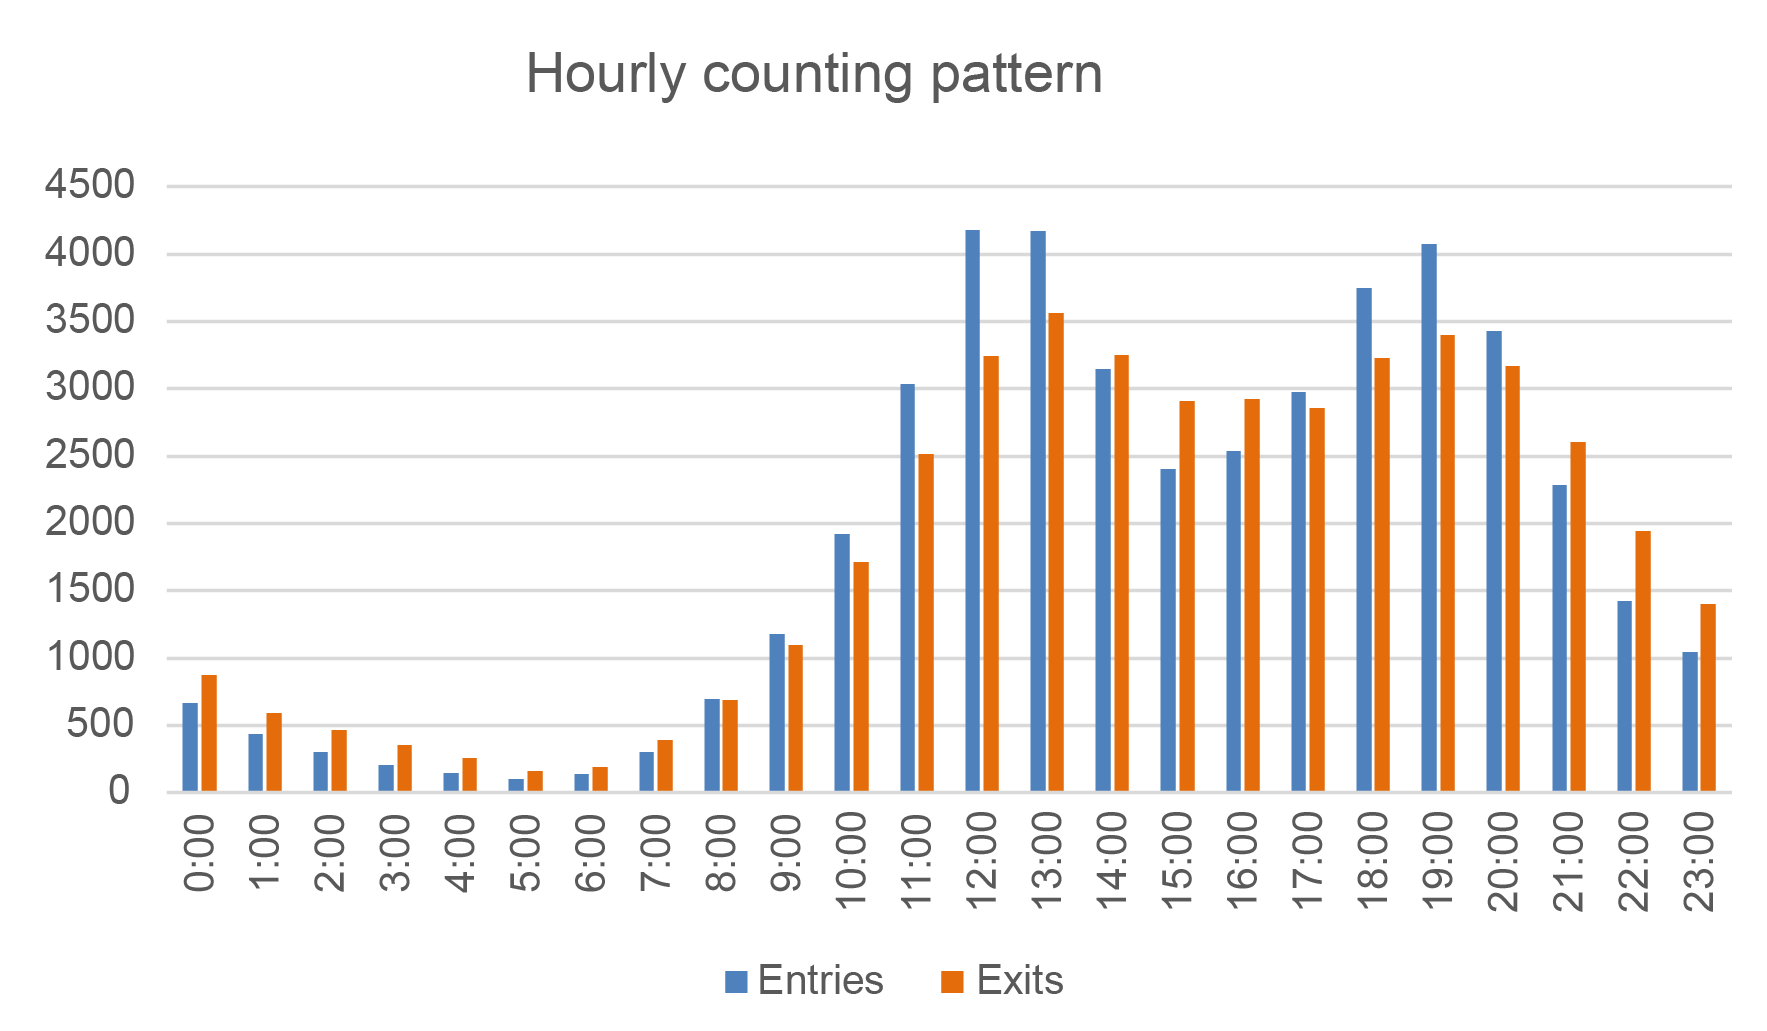
Influx of people onto the streets of the Old Town in 2023
Hourly counting pattern
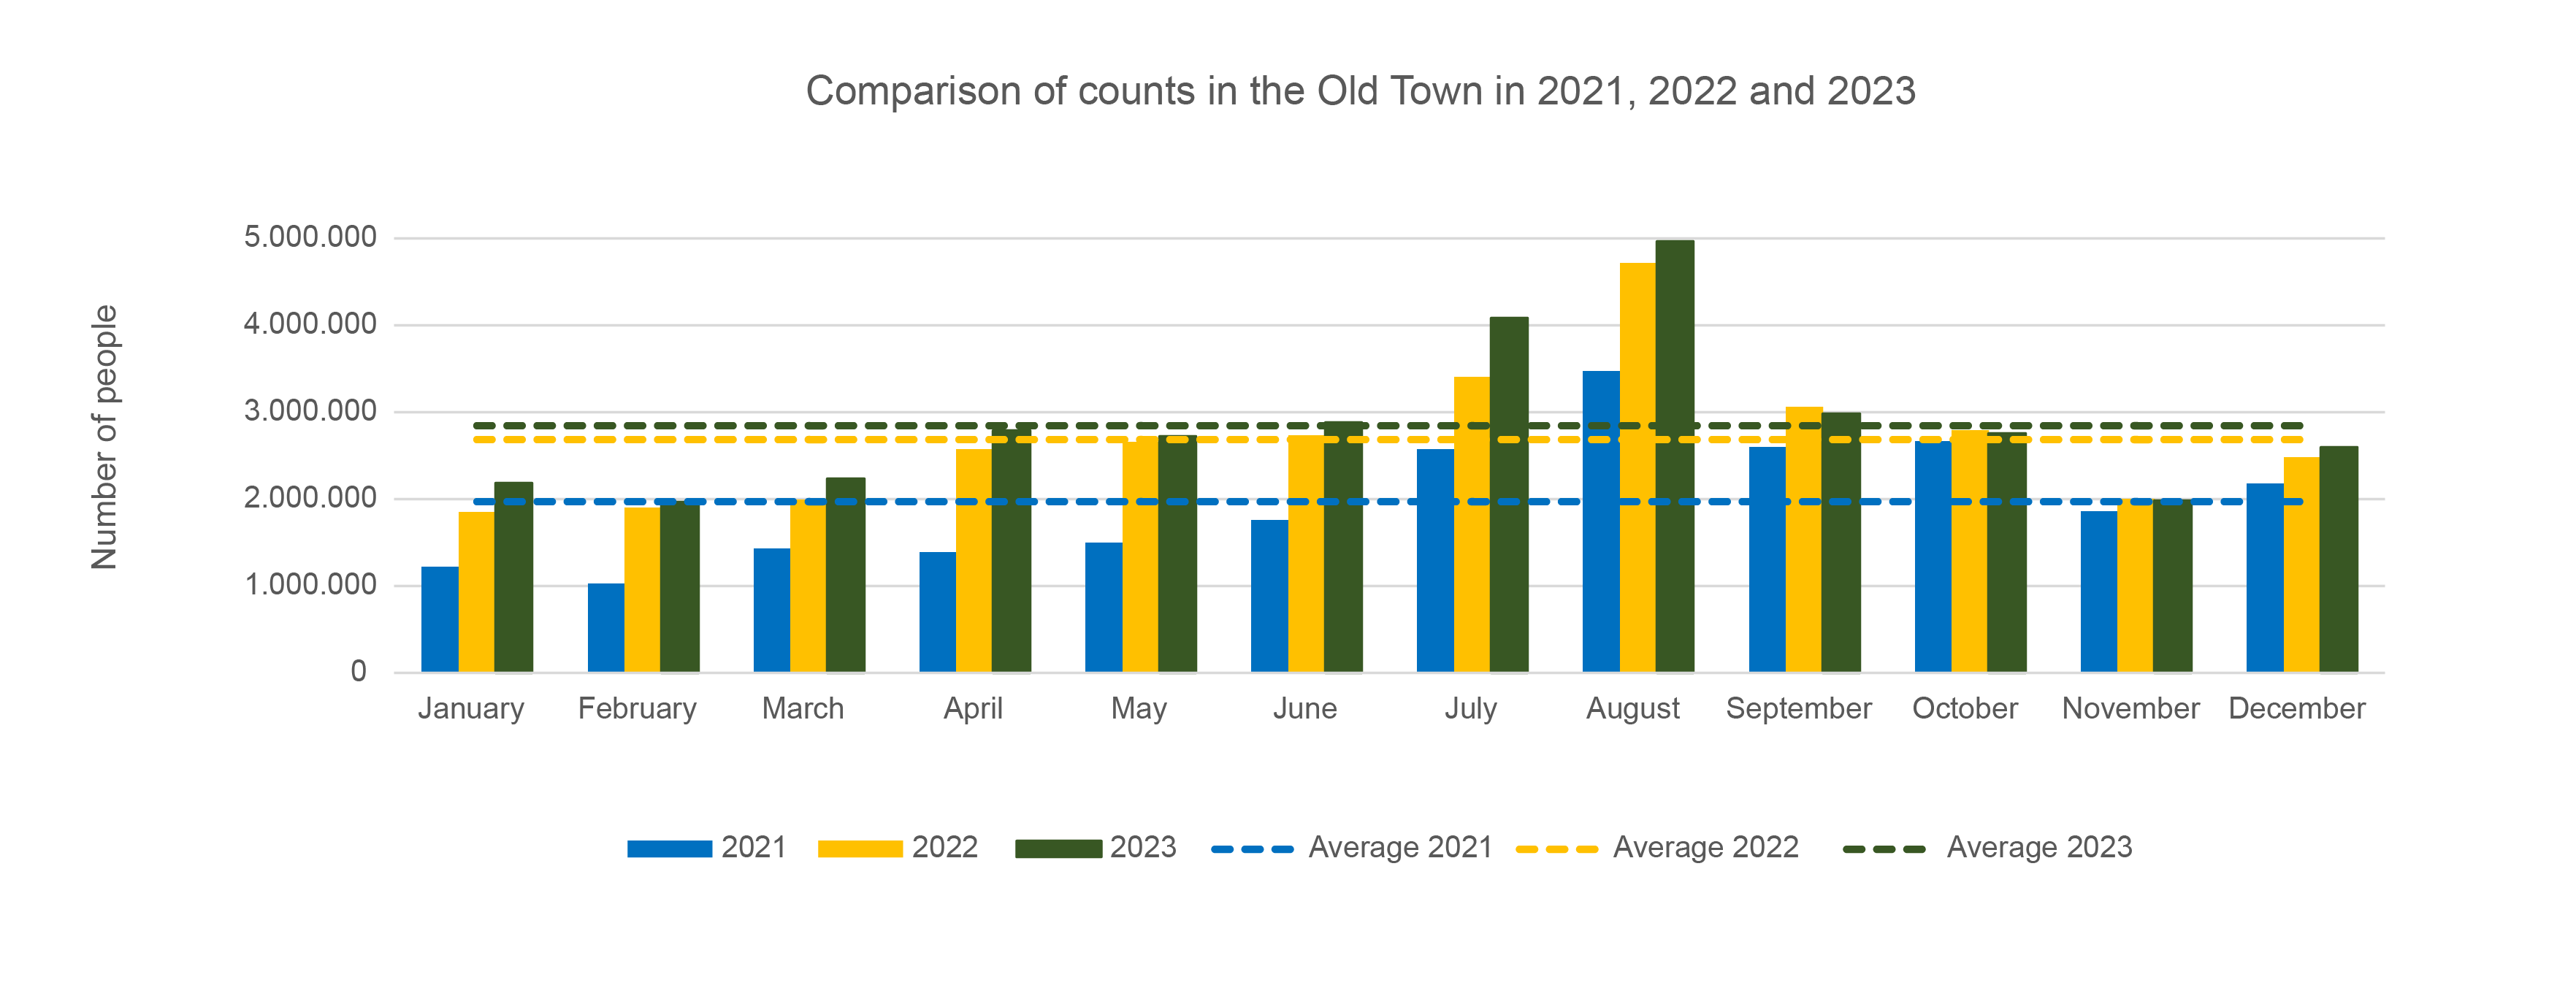
Comparison of counts in the Old Town in 2021, 2022 and 2023
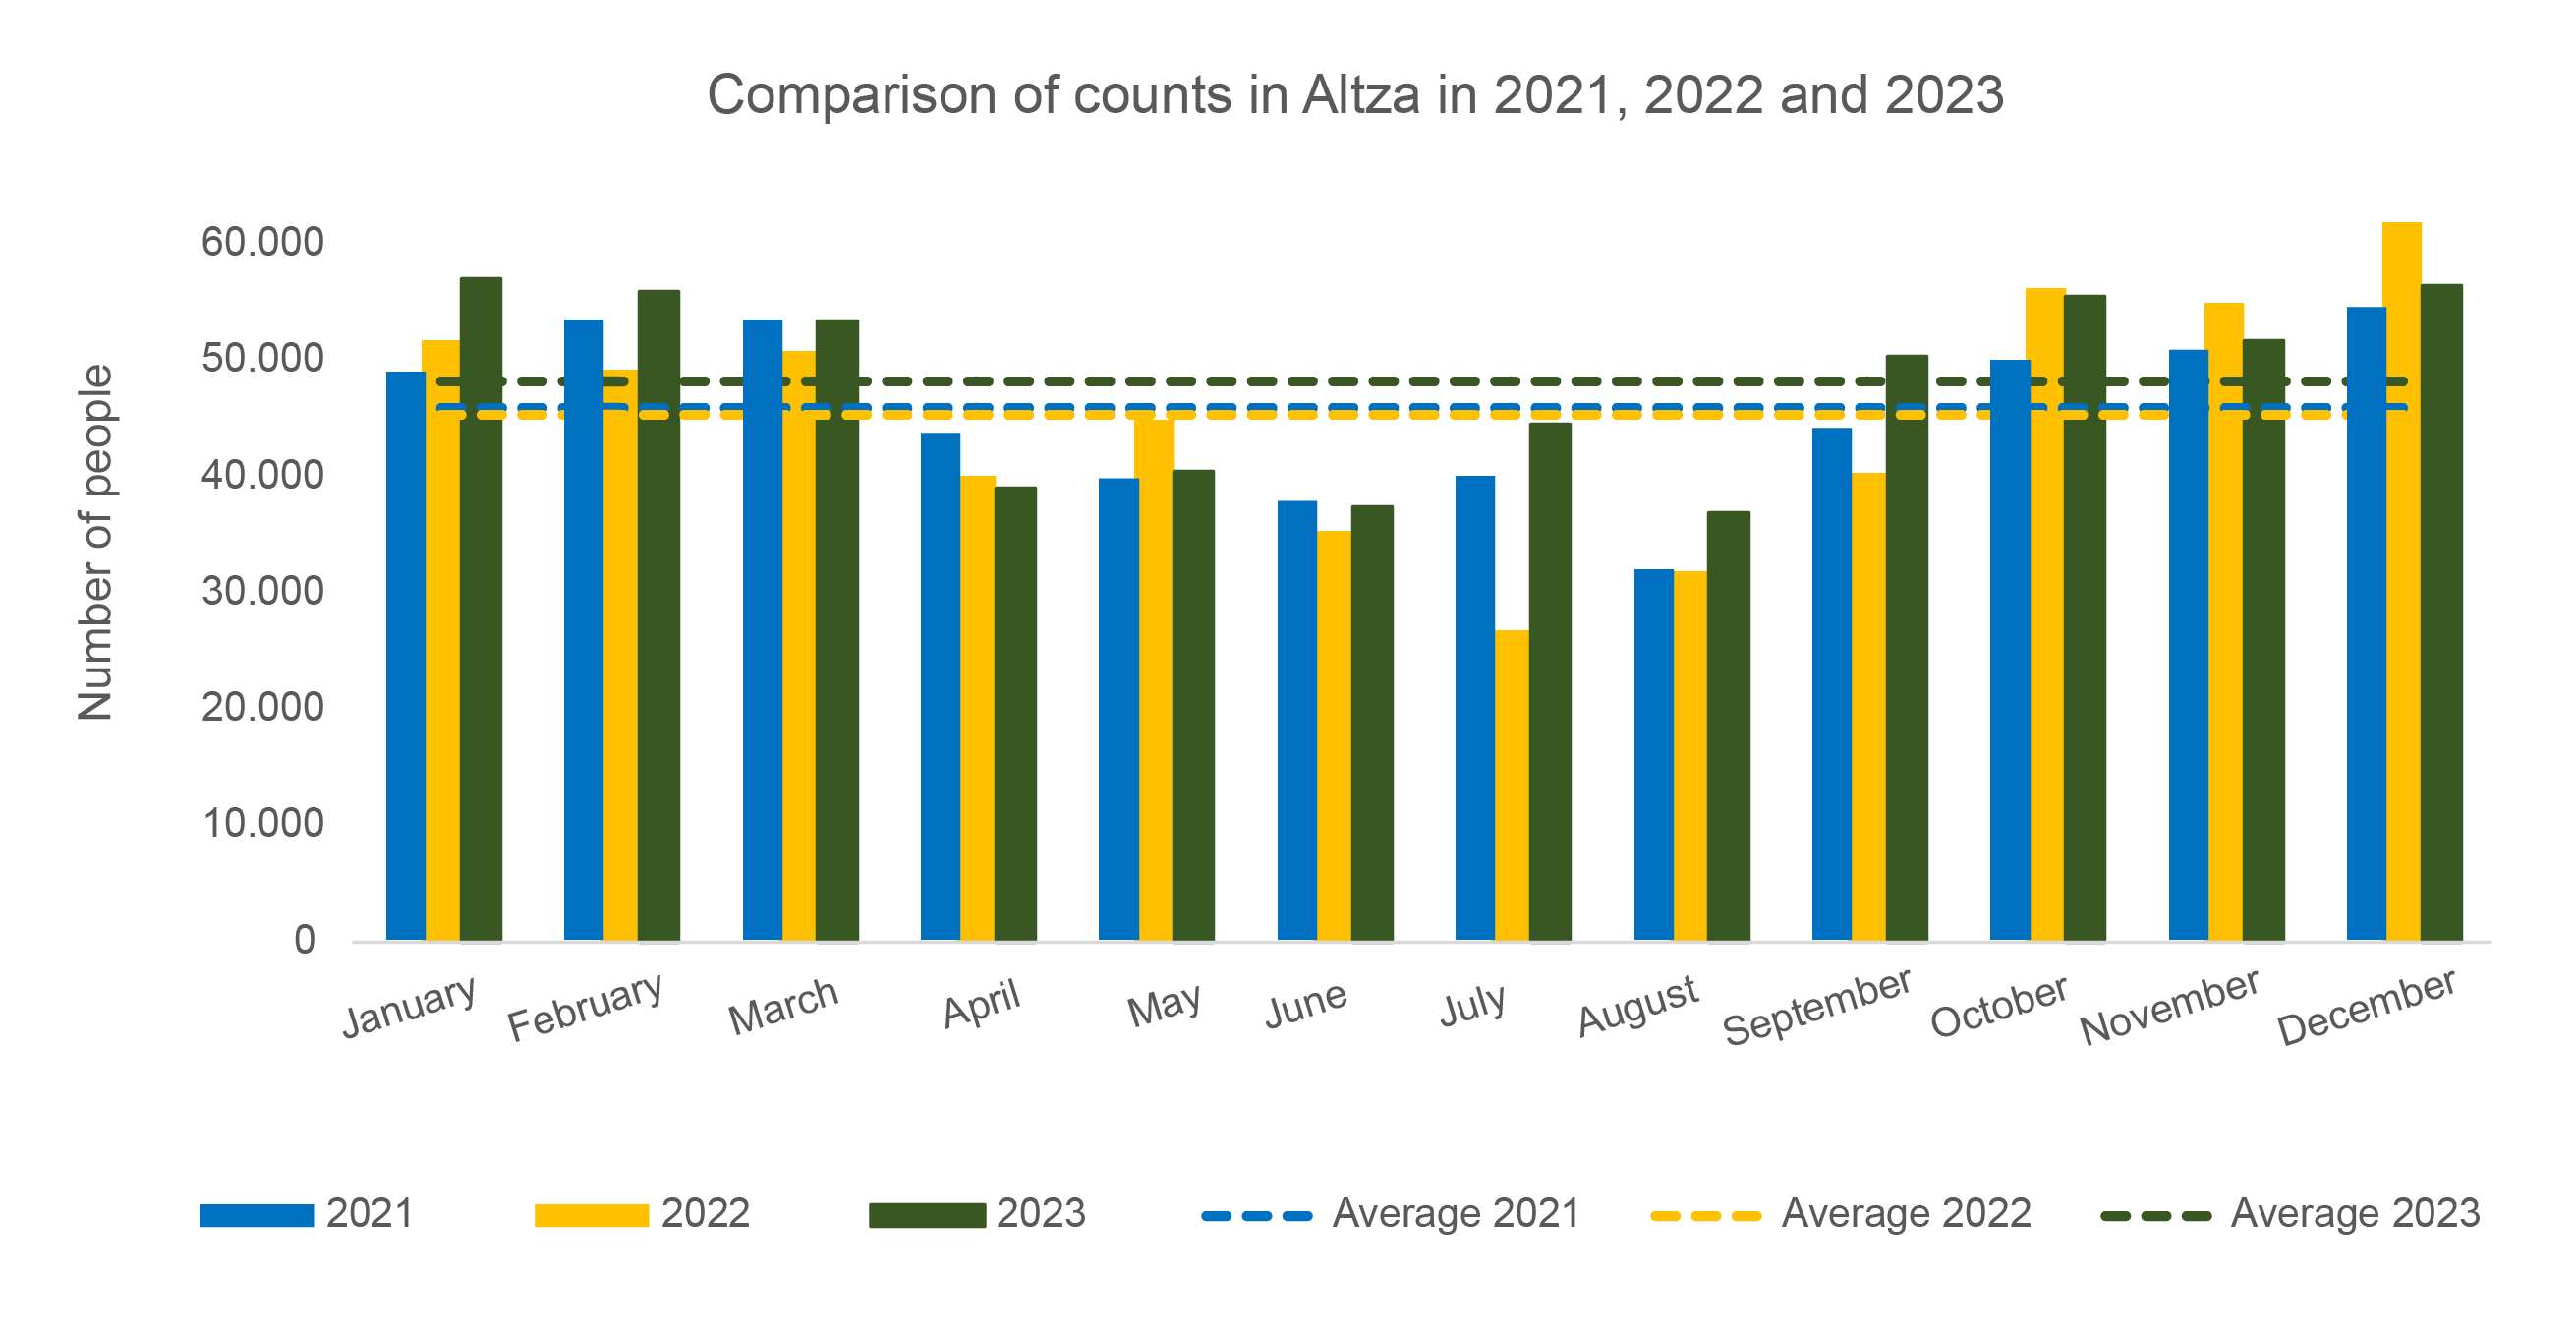
Comparison of counts in Altza in 2021, 2022 and 2023
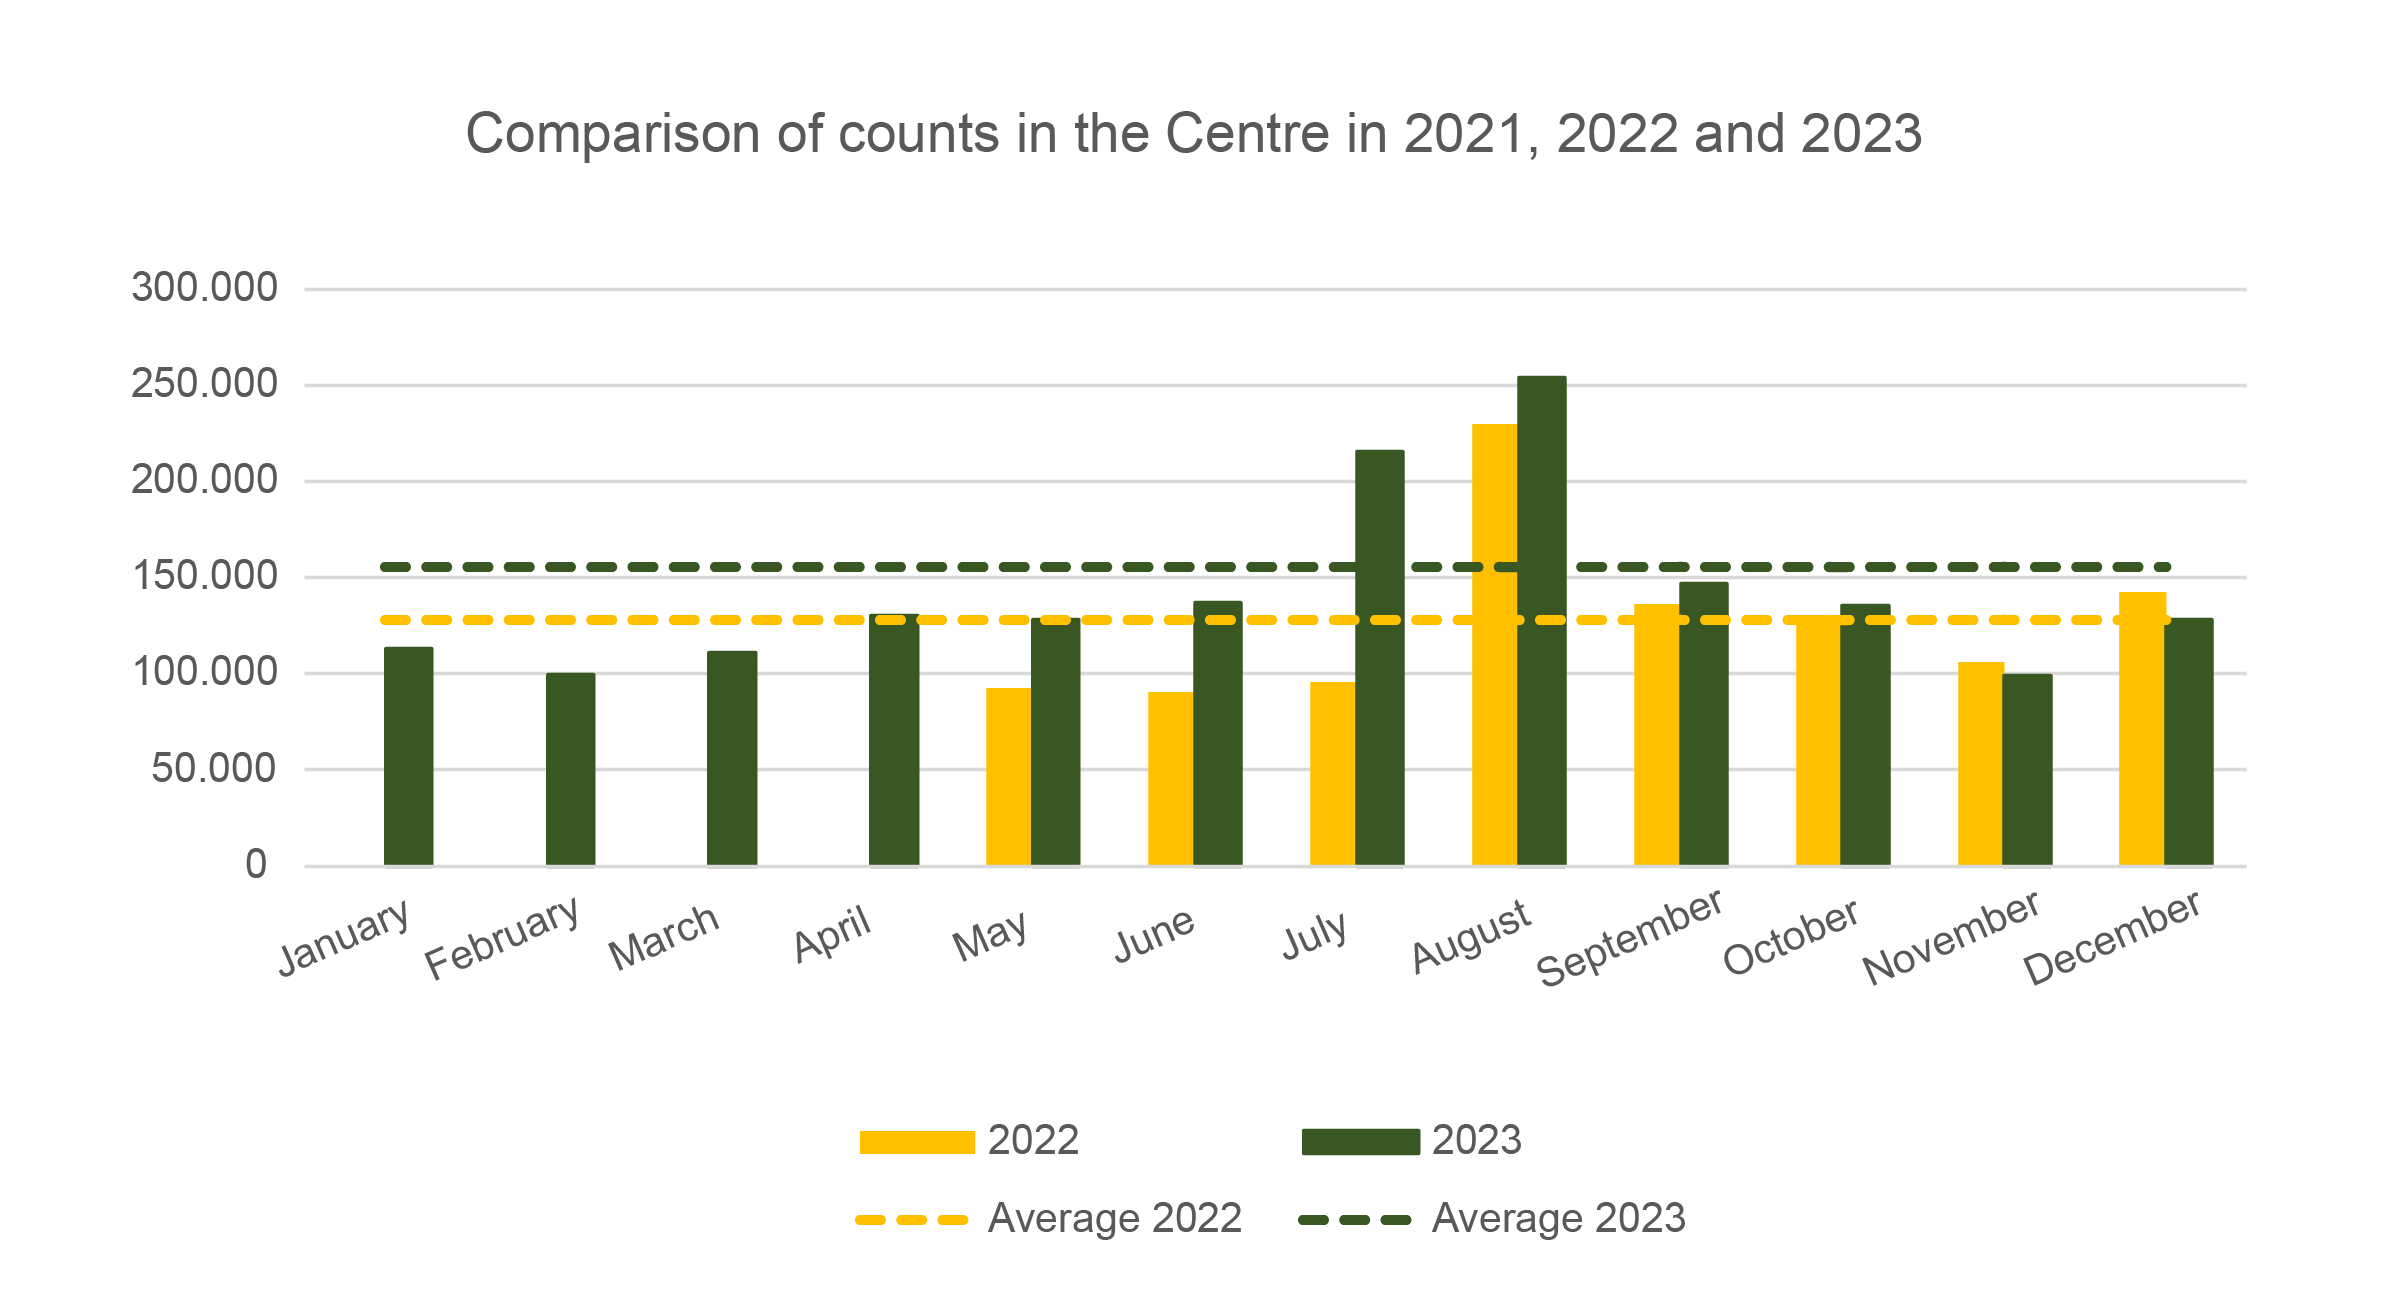
Comparison of counts in the Centre in 2021, 2022 and 2023
Volume of traffic on weekdays, Saturdays and public holidays in Sancho el Sabio
Vehicle traffic flow in 2022 and 2023 in Txomin and Sancho el Sabio
What has been measured?
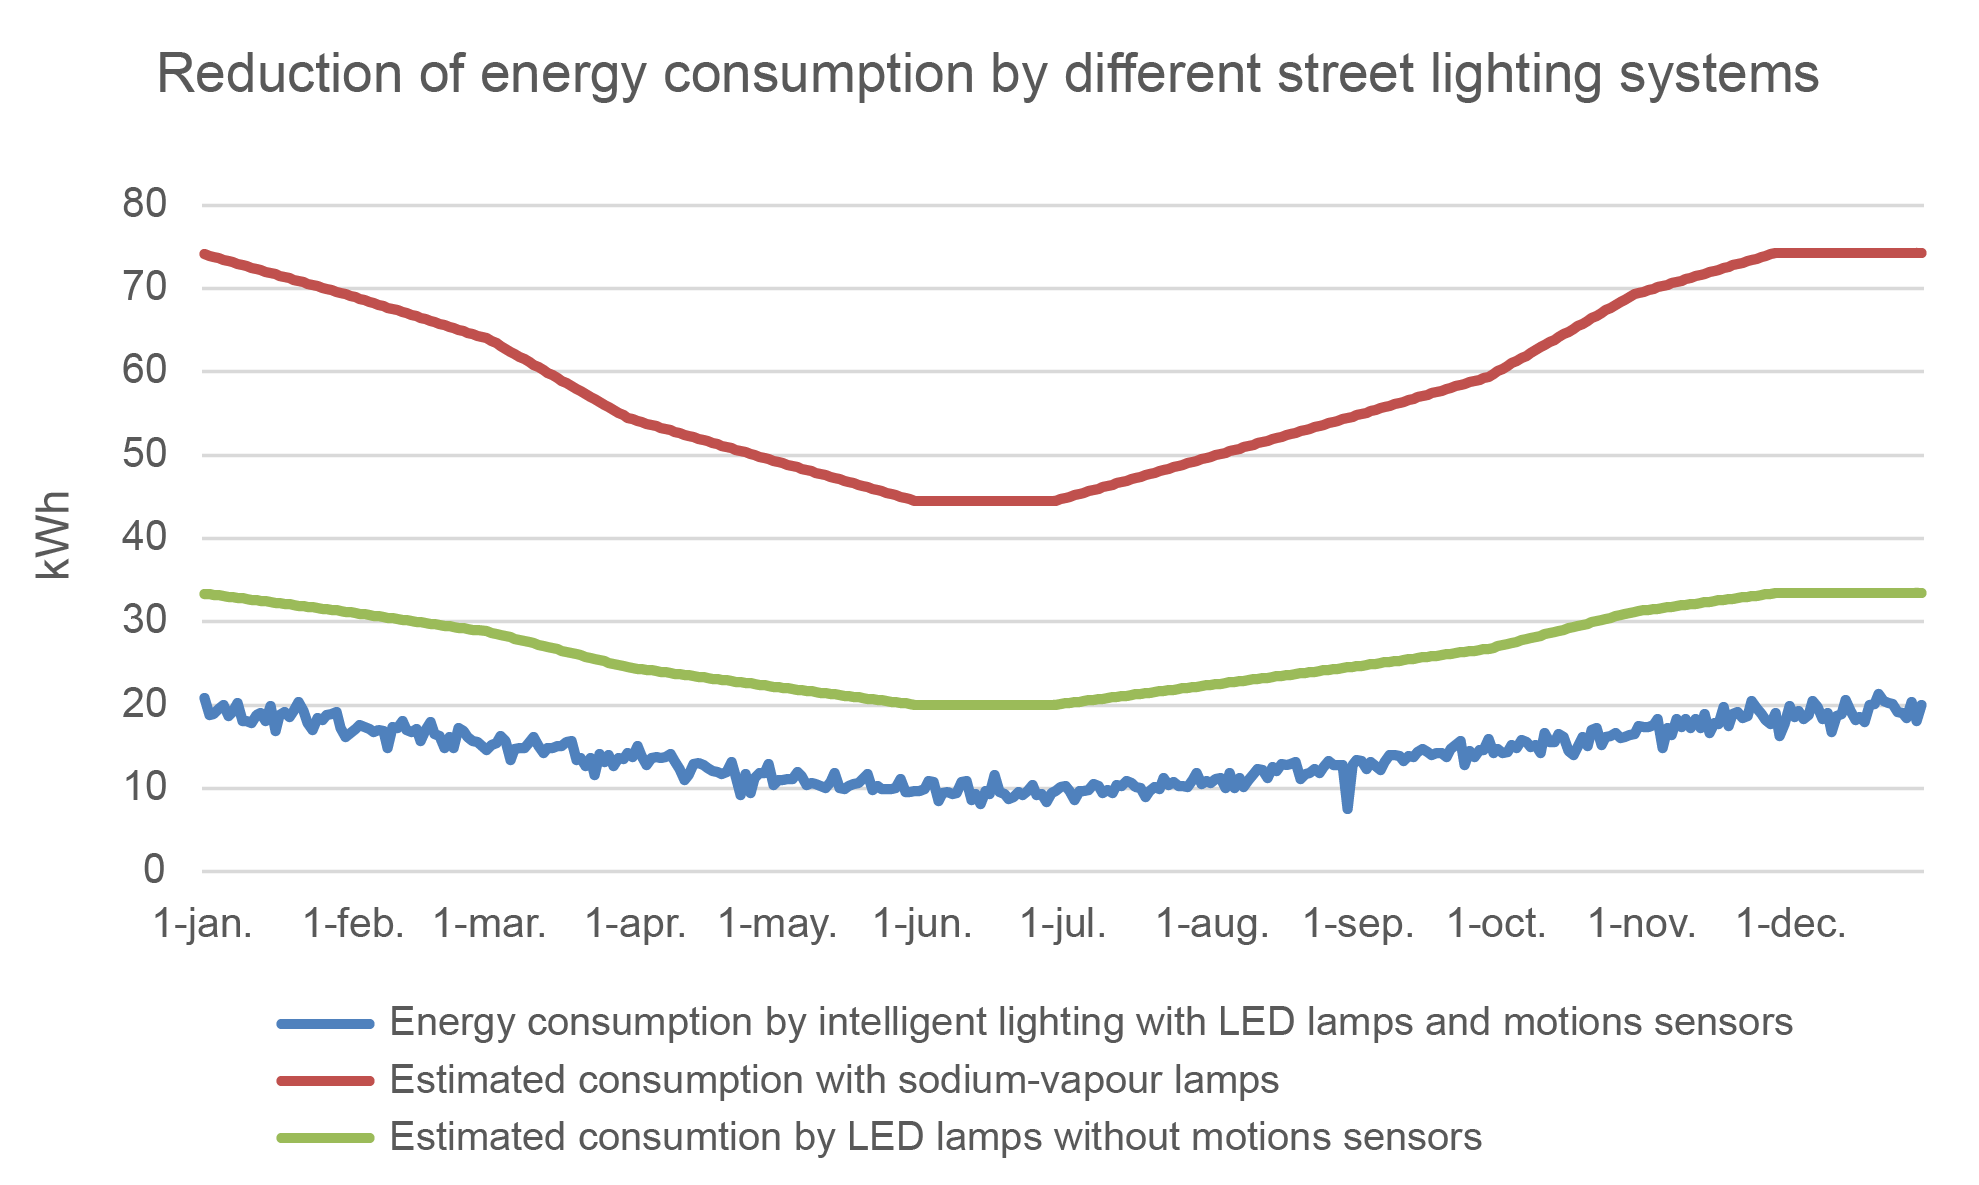
A smart lighting system with LED lights, which are more efficient than traditional sodium-vapour lights, has been installed in Calle Mayor and Paseo de Altza as part of the SmartKalea project. The system is equipped with a system for detecting the presence of people, which allows the lighting level to be adjusted depending on the presence or absence of people, thereby helping to save electricity in the urban lighting system.
Energy consumption data has been collected daily on the SmartKalea platform for street lighting in Calle Mayor and Paseo de Altza, which has made it possible to calculate the energy savings obtained thanks to the new smart lighting system.
What district?
Select a measurement period
Average daily electricity consumption by intelligent lighting with LED lamps and motion sensors
kWh
Which would be the energy consumption if there was no lighting control?
ESTIMATED SAVINGS IN ENERGY CONSUMPTION WITH SMART LIGHTING COMPARED TO CONVENTIONAL LIGHTING
ESTIMATED SAVINGS IN LED LIGHTING CONSUMPTION BY INSTALLING PRESENCE DETECTORS IN ALTZA
ESTIMATED SAVINGS IN LED LIGHTING CONSUMPTION BY INSTALLING PRESENCE DETECTORS IN THE LIGHTING IN THE OLD TOWN
YEAR 2021
YEAR OF LOWER CONSUMPTION DUE TO NIGHT-TIME MOBILITY RESTRICTIONS DURING THE PANDEMIC. AS THE PRESENCE OF PEOPLE IS NOT DETECTED, CONSUMPTION IS MINIMISED.
Reduction of energy consumption by different street lighting systems
What has been measured?
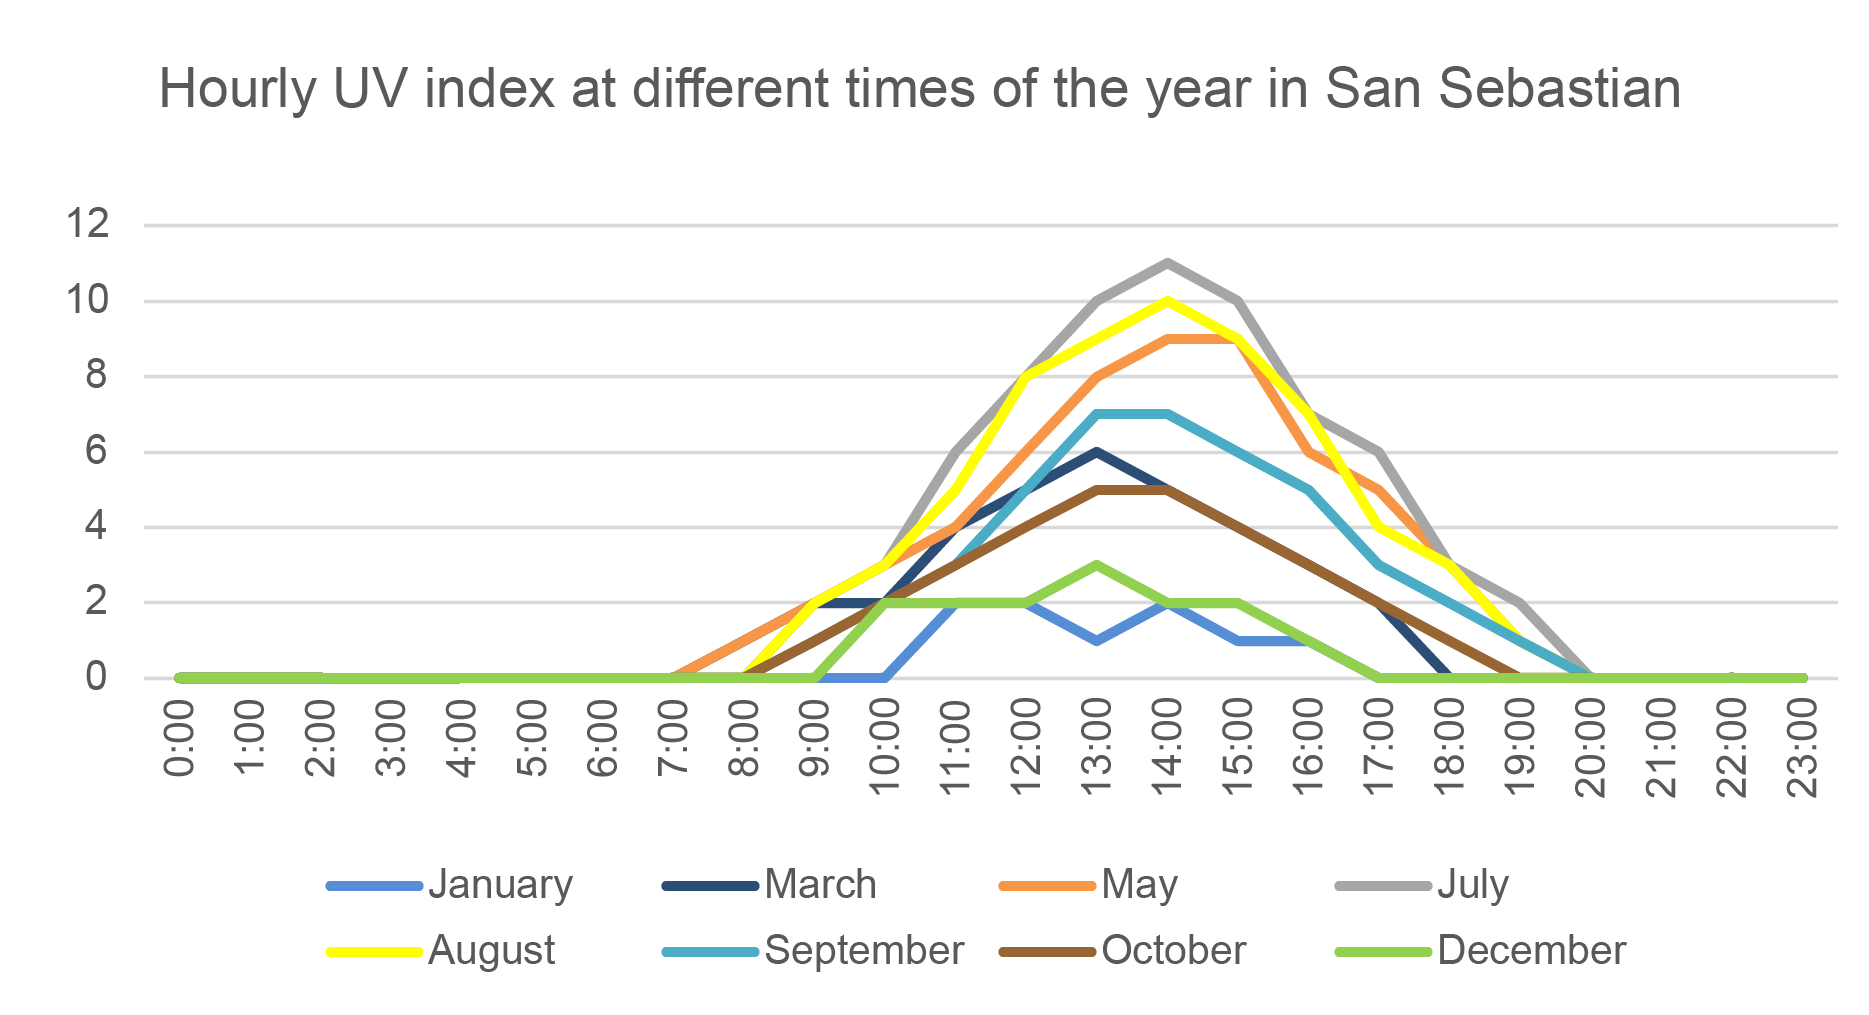
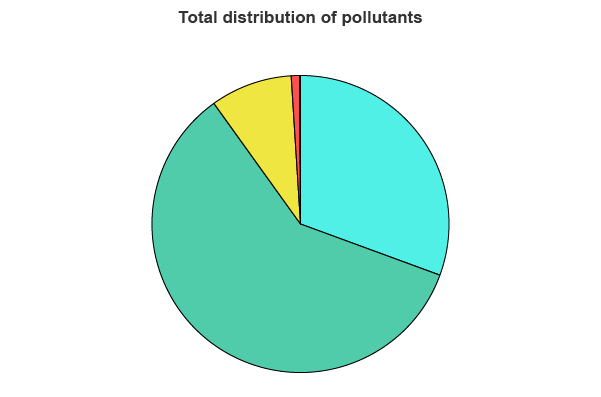
Solar radiation and air quality have been monitored as part of the SmartKalea project by installing various sensors in the city in the Centre, the Old Town, Altza, Sancho el Sabio and Txomin.
The UV index is an indicator of the intensity of UV radiation from the sun on the earth's surface. It also provides an indication of the ability to produce skin lesions.
The air quality sensors installed in the city have provided interesting baseline information, although they are not used to accurately evaluate air quality, as the measurements collected at the stations deployed by the Basque Government's Department of the Environment, Spatial Planning and Housing are used for this purpose. These measurements can be viewed by clicking on the link below:
https://www.euskadi.eus/web01-a2ingai2/es/aa17aCalidadAireWar/estacion/mapa?locale=es
Days with a daily air quality index rated as very good or good
94,2
%
Days with a daily air quality index rated as poor
<1
%
Air quality according to PM2.5 in the world
The air quality in different cities of the world is shown according to the concentration of PM2,5 particles detected for the current month based on average historical data.
Fuentes
http://waqi.info/

Hourly UV index at different times of the year in San Sebastian
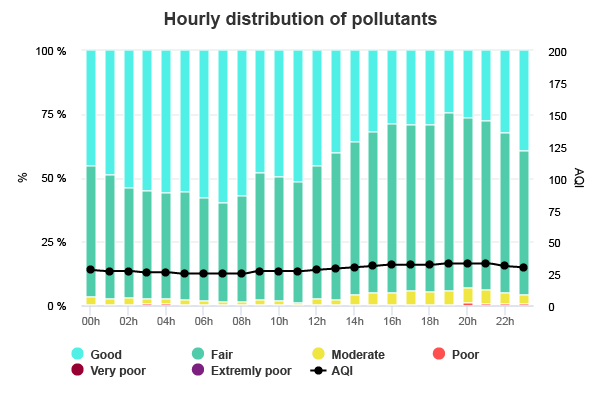
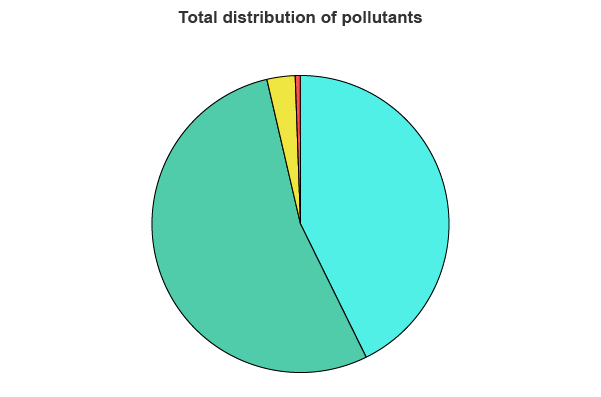
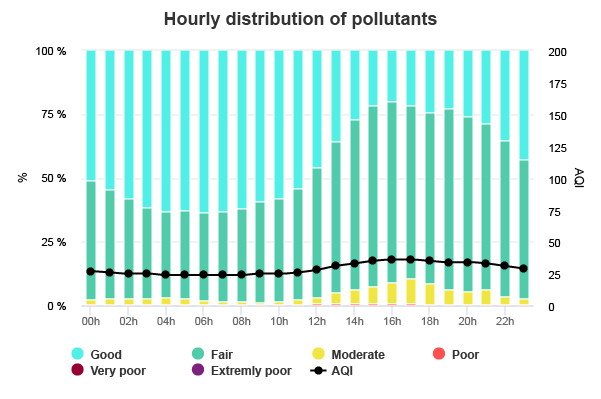
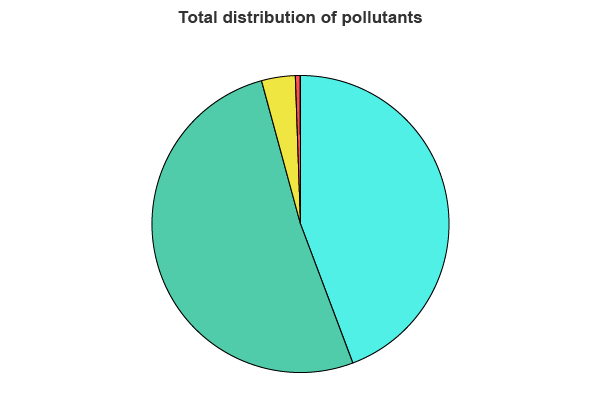
Air quality in the Centre
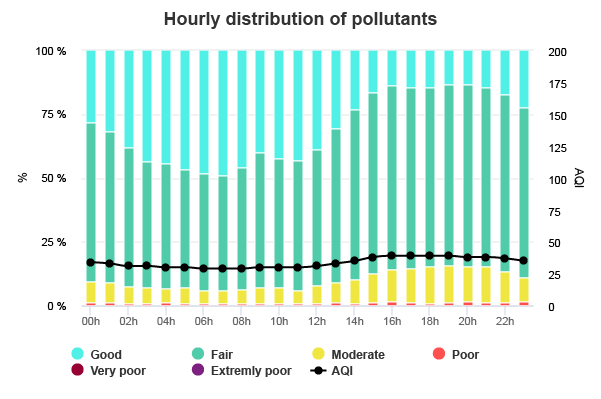
Note: The Plaza Cervantes sensor, due to its proximity to the beach, detects some peaks of PM10 particles, due to marine aerosols of natural origin.
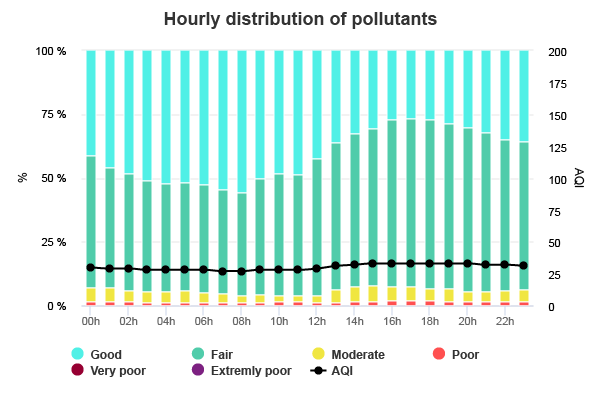
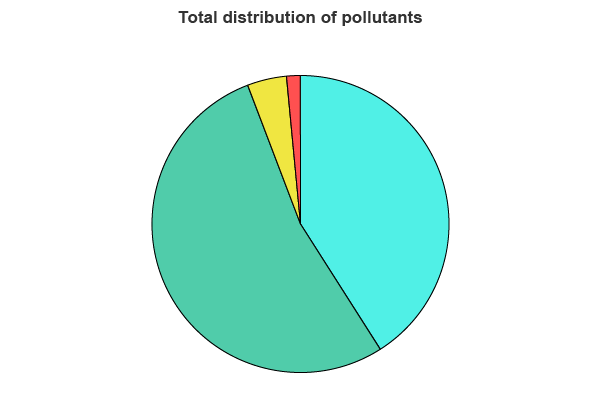
Air quality in Altza
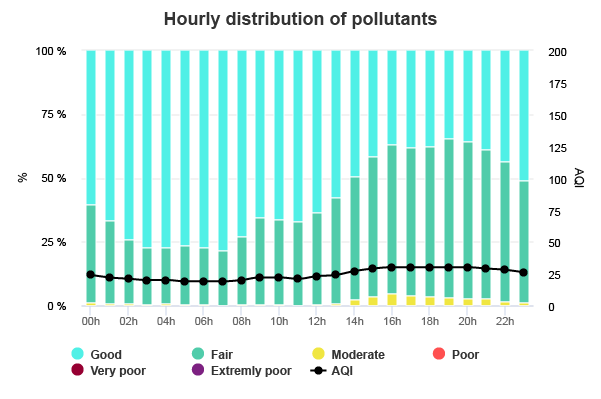
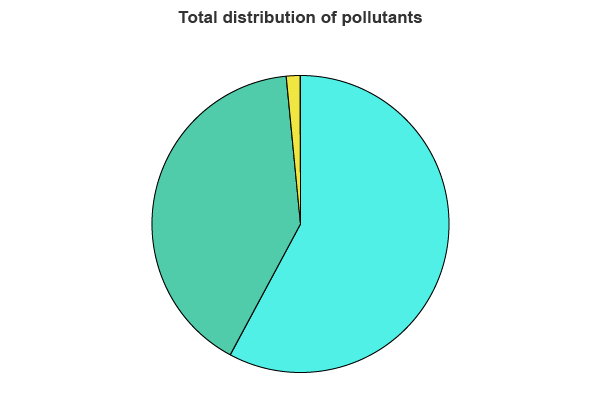
Air quality in Sancho el Sabio
Air quality in the Old Town
Air quality in Txomin
Did you know that…?
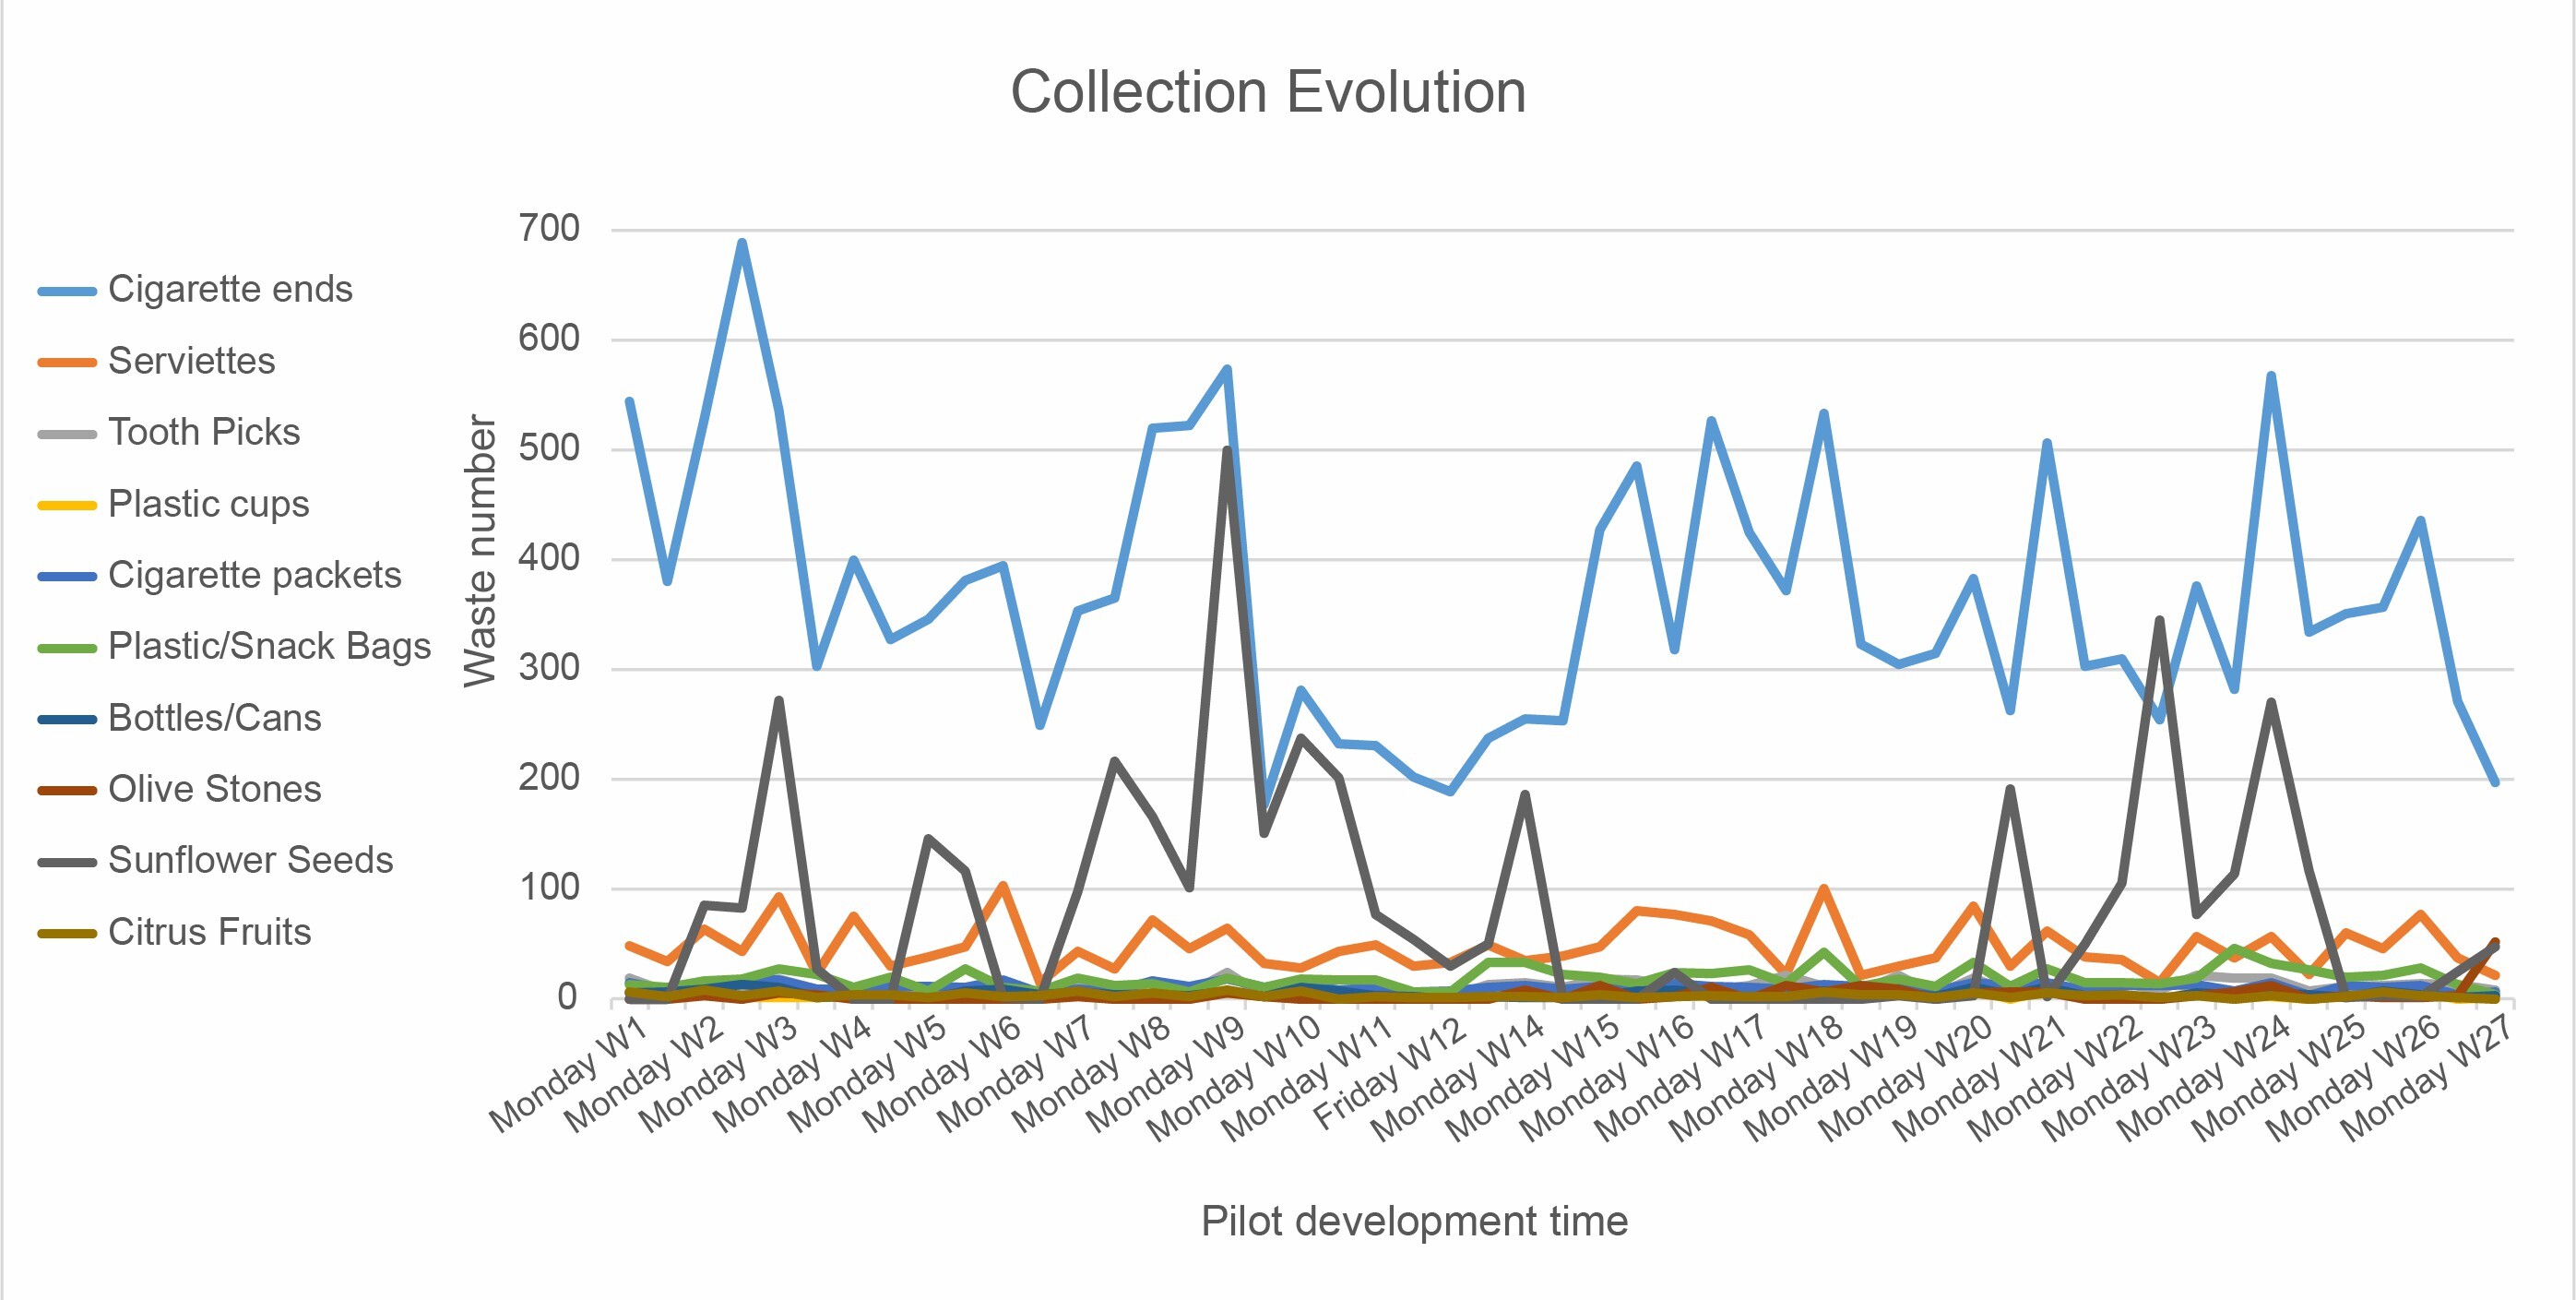
The SmartKalea project carried out a study of waste collected during street cleaning between 2018 - 2019. This campaign was part of a 6-month pilot initiative that consisted of collecting and analysing waste dumped at 5 control points in the Altza neighbourhood. This involved the collaboration of the municipal cleaning services, Fomento Construcciones y Contratas SA (FCC), who were responsible for collecting and identifying the waste at the same time on the same days (Mondays and Fridays) over the 27 weeks of the campaign.
The aim was to improve the environmental quality of Altza by reducing the volume of waste on urban roads, and to implement measures to raise public awareness of the harm caused by litter.
The data collected by the municipal cleaning services were monitored in this section, with a breakdown by type, day of the week, week and street to be analysed. The main conclusion was that the most common waste was cigarette butts, followed by sunflower seeds, serviettes and snack bags.
Where do you want to measure?
When do you want to measure?
Evolution of waste collected by type
Evolution
This next graph shows the evolution of the number of each type of waste product collected over the course of the pilot project.